Aurobindo Pharma picking up momentum.Aurobindo Pharma Ltd. engages in the manufacturing of generic pharmaceuticals and active pharmaceutical ingredients. It operates under the following geographical segments: India, USA, Europe, and Rest of the World. Its portfolio includes antibiotics, anti-retroviral, cardiovascular, central nervous system, gastroenterological, anti-allergies, and anti-diabetics.
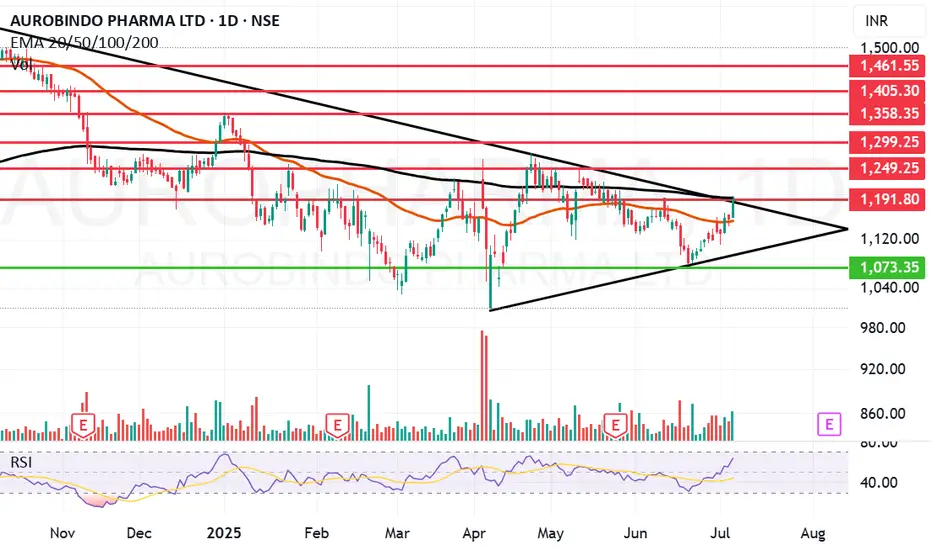
Aurobindo Pharma Ltd. Closing price is 1191.30. The positive aspects of the company are moderate Valuation (P.E. = 19.8), Strong cash generating ability from core business - Improving Cash Flow from operation, Companies with Low Debt, FII / FPI or Institutions increasing their shareholding, RSI indicating price strength and MFs increased their shareholding last quarter. The Negative aspects of the company are Stocks Underperforming their Industry Price Change in the Quarter and High promoter stock pledges.
Entry can be taken after closing above 1192 Historical Resistance in the stock will be 1249, 1299 and 1358. PEAK Historic Resistance in the stock will be 1403 and 1461. Stop loss in the stock should be maintained at Closing below 1073 or 986 depending upon your risk taking ability.
Disclaimer: The above information is provided for educational purpose, analysis and paper trading only. Please don't treat this as a buy or sell recommendation for the stock or index. The Techno-Funda analysis is based on data that is more than 3 months old. Supports and Resistances are determined by historic past peaks and Valley in the chart. Many other indicators and patterns like EMA, RSI, MACD, Volumes, Fibonacci, parallel channel etc. use historic data which is 3 months or older cyclical points. There is no guarantee they will work in future as markets are highly volatile and swings in prices are also due to macro and micro factors based on actions taken by the company as well as region and global events. Equity investment is subject to risks. I or my clients or family members might have positions in the stocks that we mention in our educational posts. We will not be responsible for any Profit or loss that may occur due to any financial decision taken based on any data provided in this message. Do consult your investment advisor before taking any financial decisions. Stop losses should be an important part of any investment in equity.
Auropharmalong
AUROPHARAM Swing Long SetupEnter only when 15minute candle closes above the Entry Zone Price - 1461.70
Target with Risk to reward 1:2 is 1571.1
Stoploss only when 1 day candle closes below the price - 1407
Note: This is not any financial advice, this is for education purpose only.

{AUROPHARMA}:{HIGH RETURN TRADE }
Price is retracing into a Daily Demand and there is a 1H Demand coincided with the Daily Demand which makes this 1H Demand a Special Demand

AUROPHARMA : flag pattern in 1HAUROPHARMA given breakout of Flag pattern in 1 hour chart. good R:R even best if we get retest and then bull candle can be best choice to enter in trade
#AUROPHARMA
Levels are marked on chart for intraday. Follow price action and become Price action chart Specialist.
Like, Share, Comment for regular updates.
Disclaimer
I am not sebi registered analyst
My studies are Educational purpose only
Please consult with your Financial advisor before trading or investing
I may be 100% wrong as its my personal trade.
First Learn and then remove "L"

AUROPHARMA LONG POSITIONAL As per my theory and experience Auropharma forms bullish reversal classic pattern
Educational Levels marked for positional trade

AuropharmaAuropharma made butterfly pattern on daily & hourly charts with more than average volumes.
Could be bought with mentioned stoploss & targets.

AUROPHARMA Bounced off Demand zone. Go Long accordinglyHello Guys the Market have been Quite a good ride in the previous week and it was fun.
Last target of 10% in MAXHEALTH was hit in one day.
Now Auropharma was in a downtrend/correction phase for some time and now has reached a strong Demand Zone(Daily, Weekly, Monthly) and took a good >10% bounced of it and is making HH & HL in smaller timeframes. Now consolidating in a channel which is a bullish channel and I expect big upmove after the break of channel.
RSI has room for Bulls.
MACD is retreating from bearish side and now going towards bullish.
Demand zone bounce has already been confirmed.
BUY ABOVE - 687
Targets mentioned in the chart.
Manage your positions, Risk reward is good.
Please LIKE, COMMENT and SHARE to motivate and support me. I'll keep on posting new ideas on Indices & Stocks. Be sure to follow so that you don't miss any good trades that might have been rewarding.
Any comments and critiques will be appreciated even if it's of opposite view as a trader can also be right so many times.

AuropharmaAuropharma made butterfly pattern on hourly charts.
Buy Auropharma with sloss of 716 & tgt of 742

Auropharma looks goodAuropharma looks good, sustaining 1025 levels, it could move 1056 levels in the near term.


