AUDUSD: Rate Cut Tuesday + Price At A Daily -FVG! Time To Sell?Welcome back to the Weekly Forex Forecast for the week of Aug 11 - 15
In this video, we will analyze the following FX market: AUDUSD
AUDUSD has been difficult to trade, as it chops its slow grind upwards. Then last, although the week's trading range was small, the Weekly candle closed as a bearish Inside Bar. This, as price made contact with a -FVG! The scenario could be laying the ground work for a new bearish leg to form.
Couple the above with an interest rate cut coming Tuesday for the AUD, and August being a historically bad month for the aussie, things could get real interesting for sellers next week.
Enjoy!
May profits be upon you.
Leave any questions or comments in the comment section.
I appreciate any feedback from my viewers!
Like and/or subscribe if you want more accurate analysis.
Thank you so much!
Disclaimer:
I do not provide personal investment advice and I am not a qualified licensed investment advisor.
All information found here, including any ideas, opinions, views, predictions, forecasts, commentaries, suggestions, expressed or implied herein, are for informational, entertainment or educational purposes only and should not be construed as personal investment advice. While the information provided is believed to be accurate, it may include errors or inaccuracies.
I will not and cannot be held liable for any actions you take as a result of anything you read here.
Conduct your own due diligence, or consult a licensed financial advisor or broker before making any and all investment decisions. Any investments, trades, speculations, or decisions made on the basis of any information found on this channel, expressed or implied herein, are committed at your own risk, financial or otherwise.
Aussie

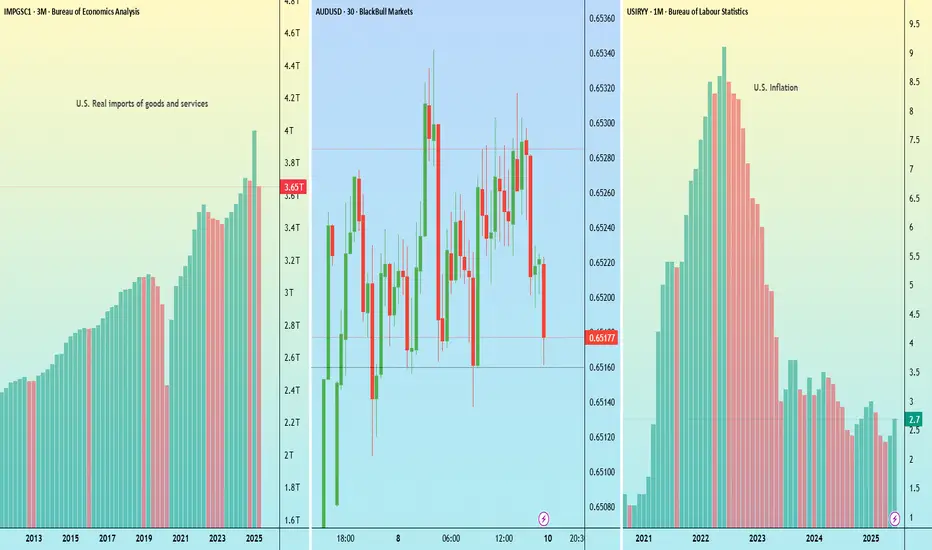
Tuesday’s triple risk: Tariffs, RBA rate cut, and U.S. inflationTraders face a busy Tuesday with developments on U.S. China trade talks, a RBA policy decision, and the latest U.S. inflation data.
U.S. China tariff deadline – Tuesday
The current truce between the U.S. and China is set to expire on 12 August, with U.S. Commerce Secretary Lutnick indicating it will likely be extended by 90 days. China may also face an additional 25% tariff on Russian oil imports, like measures already applied to India.
RBA announcement – Tuesday
The Reserve Bank of Australia is widely expected to cut rates, with a Reuters poll showing all 40 surveyed economists anticipating a 25bp reduction to 3.60%. The broader market is pricing a 98% probability of that outcome and a 2% chance of a larger 50bp cut.
U.S. CPI – Tuesday
Headline U.S. CPI for July is expected to rise 0.2% month-on-month taking the annual rate to 2.8% from 2.7%. Wells Fargo notes that the figures may show further signs of higher tariffs feeding into consumer prices.
AUD eyes yield advantage over USD UBS strategists view the Australian dollar as a compelling long opportunity at current levels, supported by expectations that the Reserve Bank of Australia will ease policy more gradually than the U.S. Federal Reserve.
The bank forecasts 75 basis points of rate cuts from the RBA through Q1 2026, compared to 100 basis points from the Fed—helping to preserve a relative yield advantage for the Aussie.
On the daily chart, AUD/USD remains within a well-defined ascending channel that began in late 2024. The pair recently bounced off the lower boundary of the channel near 0.6450, with long lower wicks potentially indicating dip-buying interest.
Immediate resistance could sit at 0.6600, followed by a major zone near 0.6670. A break above these levels could confirm bullish continuation.

AUD/USD Long Trade Setup – Buying at the Channel LowOANDA:AUDUSD
🔍 Technical Overview:
The pair is trading within a well-defined ascending channel.
A potential bullish reversal is forming at the confluence of:
Channel support
Local structural support (highlighted in orange circle)
Bullish wick rejections and slowing downside momentum
📈 Trade Idea: BUY AUD/USD
Entry: Market buy or buy near 0.6450 – 0.6465
Stop-Loss: Below the swing low and channel support at 0.64160
Target 1: 0.65150
Target 2: 0.6566
Target 3: 0.66160
Risk-to-Reward: ~1:3 R:R ratio
Monitor price action near mid-channel resistance
🧠 “If the structure speaks to you, let it echo.” – Let the price action confirm your bias before committing fully.
Previous Sell Setup at the top of channel:
Psychology Always Matters:

AUD/JPY bulls eye 99, 100The yen is broadly weaker, which is even allowing a weaker Australian dollar to rise. And with a decent bullish trend on the daily chart, I am now seeking dips within a recent consolidation range in anticipation of a move to 99 or even 100.
Matt Simpson, Market Analyst at City Index and Forex.com

AUDUSD Engineered to Drop?🧠MJTrading:
📸 Viewing Tip:
🛠️ Some layout elements may shift depending on your screen size.
🔗 View the fixed high-resolution chart here:
🔻 OANDA:AUDUSD – Tagged the Top | Smart Money Eyes Lower Levels??
📍 Perfect Respect of Channel Structure
AUDUSD has just kissed the upper boundary of a long-standing ascending channel, showing sharp rejection — a sign that premium pricing might now shift toward discount levels.
📈 The aggressive push into the highs likely aimed to clear buy stops — fulfilling smart money objectives before a potential reversal.
📉 And here’s the subtle clue:
Just below the last bullish candle lies a thin slide — a structural weakness.
If price breaks and closes below that full body bearish candle (Below 0.66000), the market could slip fast, unleashing a momentum-driven drop into the first liquidity zone (0.6520s).
🧠 For smart money lovers, this is the classic:
Sweep → Trap → Slide
📏 And for fans of parallelism, the chart’s geometry offers a rare beauty — lines in harmony, structure in rhythm, and opportunity in alignment.
🔍 What to Watch For:
Break below 0.66000 (last candle body) = entry signal
0.6520–0.6540: first liquidity zone
0.6400–0.6300: deeper cleanout, if bearish pressure sustains
Inset: DXY bouncing from long-term demand supports bearish thesis
Manage your risk wisely...
For Lower time frame traders:
Psychology Always Matters:
(Click on the pictures for caption and concepts)
#AUDUSD #SmartMoney #LiquiditySweep #ChannelTrading #ChartDesigner #MJTrading #PriceAction #Forex

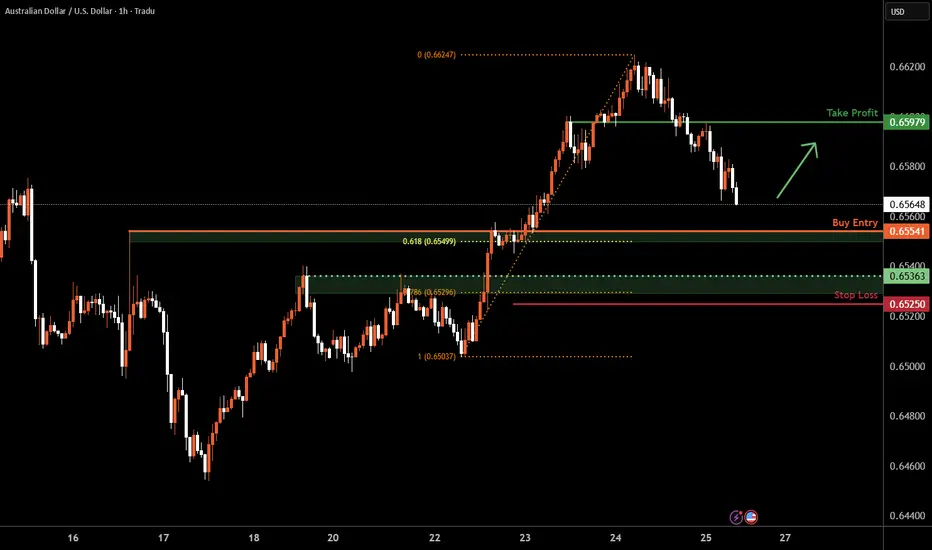
Aussie H4 | Falling toward a pullback supportThe Aussie (AUD/USD) is falling towards a pullback support and could potentially bounce off this level to climb higher.
Buy entry is at 0.6554 which is a pullback support that aligns with the 61.8% Fibonacci retracement.
Stop loss is at 0.6525 which is a level that lies underneath a pullback support and the 78.6% Fibonacci retracement.
Take profit is at 0.6597 which is a pullback resistance.
High Risk Investment Warning
Trading Forex/CFDs on margin carries a high level of risk and may not be suitable for all investors. Leverage can work against you.
Stratos Markets Limited (tradu.com ):
CFDs are complex instruments and come with a high risk of losing money rapidly due to leverage. 66% of retail investor accounts lose money when trading CFDs with this provider. You should consider whether you understand how CFDs work and whether you can afford to take the high risk of losing your money.
Stratos Europe Ltd (tradu.com ):
CFDs are complex instruments and come with a high risk of losing money rapidly due to leverage. 66% of retail investor accounts lose money when trading CFDs with this provider. You should consider whether you understand how CFDs work and whether you can afford to take the high risk of losing your money.
Stratos Global LLC (tradu.com ):
Losses can exceed deposits.
Please be advised that the information presented on TradingView is provided to Tradu (‘Company’, ‘we’) by a third-party provider (‘TFA Global Pte Ltd’). Please be reminded that you are solely responsible for the trading decisions on your account. There is a very high degree of risk involved in trading. Any information and/or content is intended entirely for research, educational and informational purposes only and does not constitute investment or consultation advice or investment strategy. The information is not tailored to the investment needs of any specific person and therefore does not involve a consideration of any of the investment objectives, financial situation or needs of any viewer that may receive it. Kindly also note that past performance is not a reliable indicator of future results. Actual results may differ materially from those anticipated in forward-looking or past performance statements. We assume no liability as to the accuracy or completeness of any of the information and/or content provided herein and the Company cannot be held responsible for any omission, mistake nor for any loss or damage including without limitation to any loss of profit which may arise from reliance on any information supplied by TFA Global Pte Ltd.
The speaker(s) is neither an employee, agent nor representative of Tradu and is therefore acting independently. The opinions given are their own, constitute general market commentary, and do not constitute the opinion or advice of Tradu or any form of personal or investment advice. Tradu neither endorses nor guarantees offerings of third-party speakers, nor is Tradu responsible for the content, veracity or opinions of third-party speakers, presenters or participants.
AUD/USD Bulls Eye BreakoutThe Australian Dollar surged more than 1.8% this week with AUD/USD now testing multi-month uptrend resistance at fresh yearly highs. A four-day rally takes price into confluent resistance at the September low / upper parallel at 6622- The focus is on today’s close with the immediate advance vulnerable while below this key slope. Subsequent resistance objectives eyed at the 2019 low at 6671 and the 78.6% retracement of the broader 2024 decline at 6723.
Initial support rests with the July open at 6581 and is backed by the May high-day close (HDC) / weekly open at 6486-6506. Losses would need to be limited to this region for the late-June advance to remain viable (near-term bullish invalidation). Subsequent support seen at the June low-day close (LDC) at 6458 with a break below 6350 ultimately needed to suggest a more significant high is in place / larger reversal is underway.
Bottom line: A breakout of the July opening-range takes AUD/USD into confluent uptrend resistance- risk for topside exhaustion / price inflection here. From a trading standpoint, a good zone to reduce portions of long-exposure / raise protective stops – losses shudl be limited to 6486 IF price is heading higher on this stretch with a close above this slope needed to fuel the next leg of the advance.
Keep in mind the FOMC interest rate decision is on tap next week with Core Personal Consumption Expenditures (PCE) and Non-Farm Payrolls (NFPs) slated into the monthly cross. Stay nimble into the releases and watch the weekly closes here.
-MB

LONG ON GBP/AUDGA has given us a CHOC (change of character) to the upside after making a new low.
Price has since pulled back to the demand area that created that change leaving us with a possible double bottom forming.
I expect GA to rise to sweep buy side liquidity at the equal highs then reaching the previous supply level / previous High.
Looking to catch 200-300 pips.

Australia faces a dilemma between inflation and labor slowdown
The RBA, in its latest meeting minutes, emphasized that the recent rate hold reflects a cautious and gradual approach toward achieving its inflation target. While the central bank noted the need for further data to confirm a decline in inflation, some Board members flagged rising unemployment as a signal of potential labor market softening. Bloomberg added that Australia’s export-driven economy remains vulnerable to tariff-related uncertainties, while private demand growth remains sluggish.
AUDUSD extended its uptrend after testing the low at 0.6455, reaching as high as 0.6560. Both EMAs narrow the gap, indicating a potential shift toward bullish momentum. If AUDUSD holds above both EMAs, the price could gain upward momentum toward the high at 0.6595. Conversely, if AUDUSD breaks below the support at 0.6540, the price may retreat toward 0.6510.

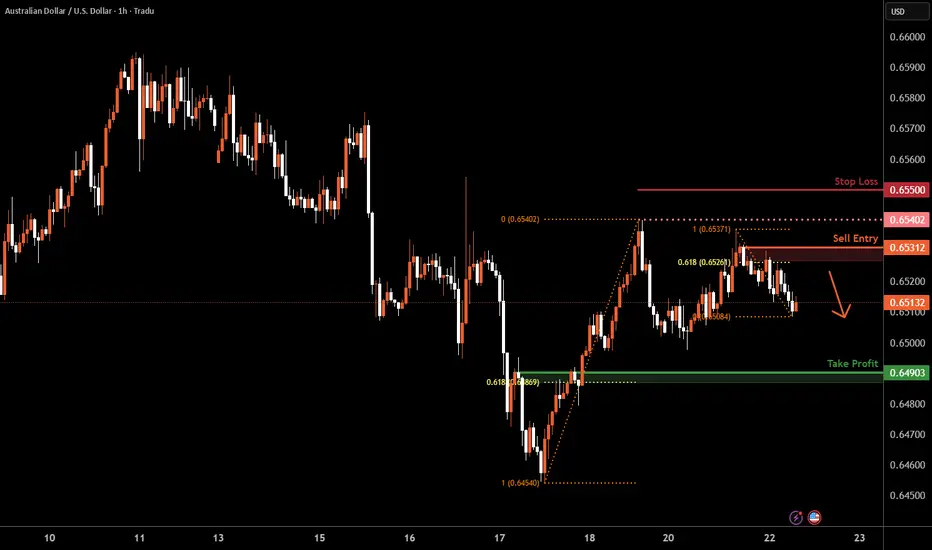
Aussie H1 | Swing-high resistance at a 61.8% Fibo retracementThe Aussie (AUD/USD) is rising towards a swing-high resistance and could potentially reverse off this level to drop lower.
Sell entry is at 0.6531 which is a swing-high resistance that aligns closely with the 61.8% Fibonacci retracement.
Stop loss is at 0.6550 which is a level that sits above a swing-high resistance.
Take profit is at 0.6490 which is a pullback support that aligns with the 61.8% Fibonacci retracement.
High Risk Investment Warning
Trading Forex/CFDs on margin carries a high level of risk and may not be suitable for all investors. Leverage can work against you.
Stratos Markets Limited (tradu.com ):
CFDs are complex instruments and come with a high risk of losing money rapidly due to leverage. 66% of retail investor accounts lose money when trading CFDs with this provider. You should consider whether you understand how CFDs work and whether you can afford to take the high risk of losing your money.
Stratos Europe Ltd (tradu.com ):
CFDs are complex instruments and come with a high risk of losing money rapidly due to leverage. 66% of retail investor accounts lose money when trading CFDs with this provider. You should consider whether you understand how CFDs work and whether you can afford to take the high risk of losing your money.
Stratos Global LLC (tradu.com ):
Losses can exceed deposits.
Please be advised that the information presented on TradingView is provided to Tradu (‘Company’, ‘we’) by a third-party provider (‘TFA Global Pte Ltd’). Please be reminded that you are solely responsible for the trading decisions on your account. There is a very high degree of risk involved in trading. Any information and/or content is intended entirely for research, educational and informational purposes only and does not constitute investment or consultation advice or investment strategy. The information is not tailored to the investment needs of any specific person and therefore does not involve a consideration of any of the investment objectives, financial situation or needs of any viewer that may receive it. Kindly also note that past performance is not a reliable indicator of future results. Actual results may differ materially from those anticipated in forward-looking or past performance statements. We assume no liability as to the accuracy or completeness of any of the information and/or content provided herein and the Company cannot be held responsible for any omission, mistake nor for any loss or damage including without limitation to any loss of profit which may arise from reliance on any information supplied by TFA Global Pte Ltd.
The speaker(s) is neither an employee, agent nor representative of Tradu and is therefore acting independently. The opinions given are their own, constitute general market commentary, and do not constitute the opinion or advice of Tradu or any form of personal or investment advice. Tradu neither endorses nor guarantees offerings of third-party speakers, nor is Tradu responsible for the content, veracity or opinions of third-party speakers, presenters or participants.
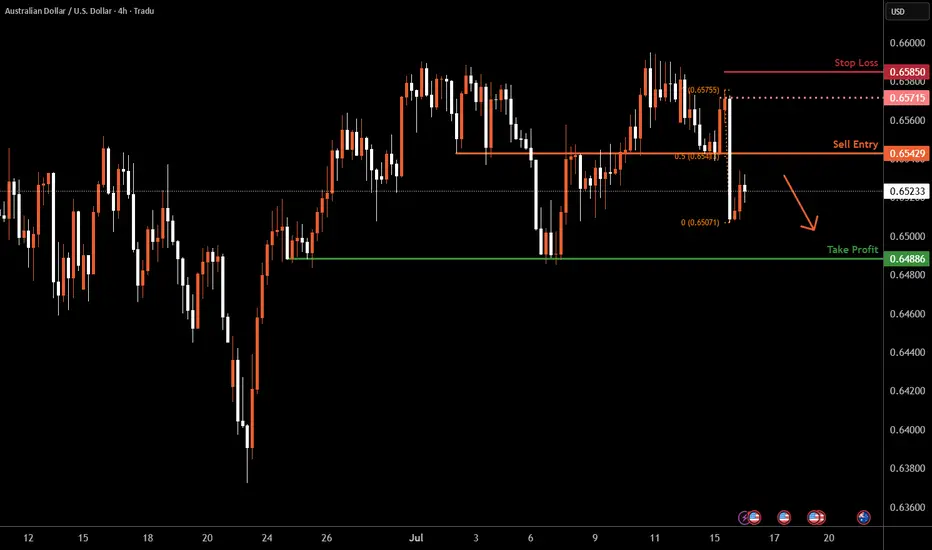
Aussie H4 | Overlap resistance at 50% Fibonacci retracementThe Aussie (AUD/USD) is rising towards an overlap resistance and could potentially reverse off this level to drop lower.
Sell entry is at 0.6542 which is an overlap resistance that aligns with the 50% Fibonacci retracement.
Stop loss is at 0.6585 which is a level that sits above a swing-high resistance.
Take profit is at 0.6488 which is a multi-swing-low support.
High Risk Investment Warning
Trading Forex/CFDs on margin carries a high level of risk and may not be suitable for all investors. Leverage can work against you.
Stratos Markets Limited (tradu.com ):
CFDs are complex instruments and come with a high risk of losing money rapidly due to leverage. 63% of retail investor accounts lose money when trading CFDs with this provider. You should consider whether you understand how CFDs work and whether you can afford to take the high risk of losing your money.
Stratos Europe Ltd (tradu.com ):
CFDs are complex instruments and come with a high risk of losing money rapidly due to leverage. 63% of retail investor accounts lose money when trading CFDs with this provider. You should consider whether you understand how CFDs work and whether you can afford to take the high risk of losing your money.
Stratos Global LLC (tradu.com ):
Losses can exceed deposits.
Please be advised that the information presented on TradingView is provided to Tradu (‘Company’, ‘we’) by a third-party provider (‘TFA Global Pte Ltd’). Please be reminded that you are solely responsible for the trading decisions on your account. There is a very high degree of risk involved in trading. Any information and/or content is intended entirely for research, educational and informational purposes only and does not constitute investment or consultation advice or investment strategy. The information is not tailored to the investment needs of any specific person and therefore does not involve a consideration of any of the investment objectives, financial situation or needs of any viewer that may receive it. Kindly also note that past performance is not a reliable indicator of future results. Actual results may differ materially from those anticipated in forward-looking or past performance statements. We assume no liability as to the accuracy or completeness of any of the information and/or content provided herein and the Company cannot be held responsible for any omission, mistake nor for any loss or damage including without limitation to any loss of profit which may arise from reliance on any information supplied by TFA Global Pte Ltd.
The speaker(s) is neither an employee, agent nor representative of Tradu and is therefore acting independently. The opinions given are their own, constitute general market commentary, and do not constitute the opinion or advice of Tradu or any form of personal or investment advice. Tradu neither endorses nor guarantees offerings of third-party speakers, nor is Tradu responsible for the content, veracity or opinions of third-party speakers, presenters or participants.
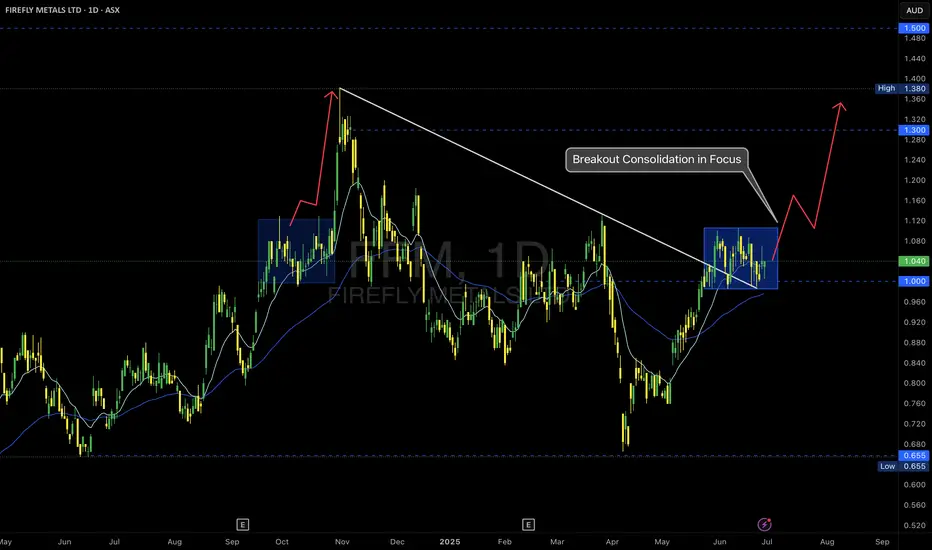
FFM -- ASX – Breakout Consolidation in Focus
📝 Description
Firefly Metals is setting up a classic breakout continuation scenario after reclaiming the $1.00 psychological level and breaking the long-term trendline resistance.
🔹 Key Observations:
• Trendline Break: The descending trendline from the prior high was decisively breached, signaling a structural shift.
• Accumulation Zone: Price has consolidated in a tight range above $1.00, forming a bullish flag or box accumulation.
• EMA Cluster Support: Both the 15 and 60 EMAs are aligned below the consolidation, providing dynamic support.
🔹 Potential Scenarios:
✅ Bullish Continuation:
A clean breakout above the top of the blue box could trigger a momentum rally toward $1.30 and ultimately the $1.38–$1.50 resistance levels.
✅ Deeper Pullback:
If price loses the $1.00 support decisively, a retracement to retest the breakout base is possible.
Trade Plan:
I am monitoring for a confirmed breakout candle with volume expansion to validate the continuation thesis.
• Entry trigger above the range high ($1.10 area)
• Stops below recent swing low / $1.00 level
• First target: $1.30 resistance
As always, risk management first—no breakout, no trade.
#MJTrading
#FFM #FireflyMetals #ASXTrading #BreakoutSetup #TechnicalAnalysis #PriceAction #TradingPlan #ChartOfTheDay #AustralianStocks #MomentumTrading #MJTrading
AUDUSD: Short Setup Ahead of Key Data OANDA:AUDUSD
AUDUSD is hovering near a rising trendline, with price action compressing and signaling a potential downside break in the coming sessions.
Just above, the 0.65900 resistance zone has capped recent rallies, and the pair’s failure to clear this level strengthens the case for a reversal.
Later today, we will see Westpac Consumer Confidence data for Australia, which could act as a catalyst for a sharp move. A weaker-than-expected print would likely pressure the Aussie further.
📋 Entry Checklist:
✅ Testing rising trendline, signaling potential breakdown
✅ Strong resistance at 0.65900 holding rallies
✅ Key consumer sentiment data could trigger volatility
📈 Trade Plan:
🔻 Sell Entry: 0.65600
❌ Stop Loss: 0.66200
✅ Take Profit: 0.65000
(Tap 👉 Trade Now 👈 on mobile to copy SL & TP easily)
📰 Fundamental Snapshot:
The Reserve Bank of Australia (RBA) surprised markets by holding rates steady at 3.85%, diverging from expectations of a potential cut. The RBA remains cautious amid persistent inflation risks driven by high labor costs and weak productivity, suggesting rates may stay restrictive longer.
Governor Michele Bullock highlighted that inflation could remain above forecasts, while Deputy Governor Andrew Hauser emphasized monitoring global uncertainties, including U.S. tariff developments, reflecting the RBA’s sensitivity to external headwinds impacting growth and trade.

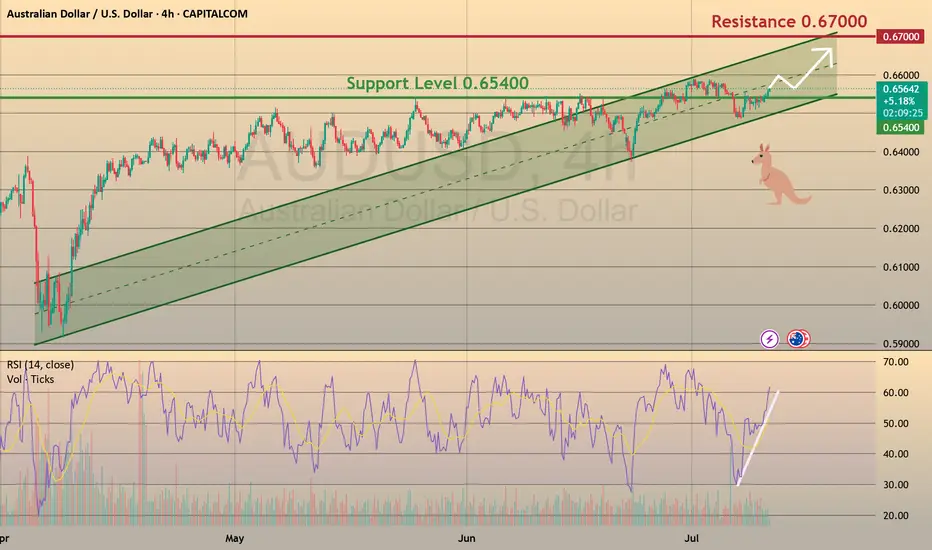
Aussie: Still Growing!
CAPITALCOM:AUDUSD
The bullish momentum continues after our last successful AUDUSD setup, and a move toward the 0.65900 resistance area looks probable now.
🪙 My Trading Plan:
🔼 BUY Stop: 0.65648
❌ Stop Loss: 0.65320
✅ Take Profit: 0.65965
💡 Why am I buying here?
✅ Price broke recent resistance at 0.65500, activating buy trades.
✅ RSI confirm ongoing bullish momentum 📊.
📰 Fundamental Situation:
🏦 RBA Rate Decision Supports AUD
The Reserve Bank of Australia (RBA) surprised markets by holding rates steady at 3.85% 🏛️, diverging from expectations of a cut. This cautious stance reflects the RBA’s preference to wait for clearer signs of slowing inflation 📉 before adjusting policy further.
Governor Michele Bullock emphasized that inflation risks remain persistent ⚠️, driven by high labor costs and weak productivity, possibly requiring a longer period of restrictive policy ⏳. Deputy Governor Andrew Hauser noted the bank is closely monitoring global risks 🌐, especially US tariff developments, underscoring sensitivity to global headwinds that could impact trade and growth 📦.
🌎 Trade Tensions in Focus:
President Trump ruled out extending tariff deadlines beyond August 1 ⛔, announcing new duties:
🔹 50% on copper 🪙
🔹 Potential 200% on pharmaceuticals 💊
🔹 10% on goods from BRICS 🌐
These moves are likely to intensify global trade tensions ⚔️, potentially impacting commodity flows and inflation, which the RBA and markets will continue to monitor closely.
Ramelius Resources (ASX: RMS) –A Tactical Re-Entry Zone?🟡 Gold-Linked Opportunity: Ramelius Resources (ASX: RMS) – A Tactical Re-Entry Zone?
Context: Ramelius Resources, a mid-tier Aussie gold producer, is showing signs of technical exhaustion after a strong rally from its 2024 lows. With gold prices consolidating and RMS pulling back to a key support zone, this could be a tactical opportunity for shareholders and swing traders alike.
📊 Technical Snapshot:
Current Price: $2.47
Trendline Support: The long-term ascending trendline remains intact, offering a potential re-entry zone for bulls.
Risk-Reward Setup: Defined green/red zones highlight a favorable R:R ratio for those targeting a rebound toward $2.80–$3.00.
🪙 Gold Correlation Insight:
The inset chart shows gold (XAU/USD) stabilizing after a volatile June. If gold resumes its uptrend, RMS could follow suit, given its strong correlation with bullion prices.
🧠 Psychological Angle:
After a 40%+ rally from the $1.78 low, some profit-taking is natural. But this pullback may shake out weak hands before a continuation move.
Watch for sentiment shifts around gold and broader risk appetite—these could be catalysts for RMS’s next leg.
#RMS #Gold #ASX #MJTrading #Forex #Trading #Investment

Aussie H4 | Pullback support at 61.8% Fibonacci retracementThe Aussie (AUD/USD) is falling towards a pullback support and could potentially bounce off this level to climb higher.
Buy entry is at 0.6514 which is a pullback support that aligns with the 61.8% Fibonacci retracement.
Stop loss is at 0.6475 which is a level that lies underneath an overlap support and the 50% Fibonacci retracement.
Take profit is at 0.6586 which is a multi-swing-high resistance.
High Risk Investment Warning
Trading Forex/CFDs on margin carries a high level of risk and may not be suitable for all investors. Leverage can work against you.
Stratos Markets Limited (tradu.com ):
CFDs are complex instruments and come with a high risk of losing money rapidly due to leverage. 63% of retail investor accounts lose money when trading CFDs with this provider. You should consider whether you understand how CFDs work and whether you can afford to take the high risk of losing your money.
Stratos Europe Ltd (tradu.com ):
CFDs are complex instruments and come with a high risk of losing money rapidly due to leverage. 63% of retail investor accounts lose money when trading CFDs with this provider. You should consider whether you understand how CFDs work and whether you can afford to take the high risk of losing your money.
Stratos Global LLC (tradu.com ):
Losses can exceed deposits.
Please be advised that the information presented on TradingView is provided to Tradu (‘Company’, ‘we’) by a third-party provider (‘TFA Global Pte Ltd’). Please be reminded that you are solely responsible for the trading decisions on your account. There is a very high degree of risk involved in trading. Any information and/or content is intended entirely for research, educational and informational purposes only and does not constitute investment or consultation advice or investment strategy. The information is not tailored to the investment needs of any specific person and therefore does not involve a consideration of any of the investment objectives, financial situation or needs of any viewer that may receive it. Kindly also note that past performance is not a reliable indicator of future results. Actual results may differ materially from those anticipated in forward-looking or past performance statements. We assume no liability as to the accuracy or completeness of any of the information and/or content provided herein and the Company cannot be held responsible for any omission, mistake nor for any loss or damage including without limitation to any loss of profit which may arise from reliance on any information supplied by TFA Global Pte Ltd.
The speaker(s) is neither an employee, agent nor representative of Tradu and is therefore acting independently. The opinions given are their own, constitute general market commentary, and do not constitute the opinion or advice of Tradu or any form of personal or investment advice. Tradu neither endorses nor guarantees offerings of third-party speakers, nor is Tradu responsible for the content, veracity or opinions of third-party speakers, presenters or participants.

AUD/USD Short: Riding the Perfect Storm to 0.6400Hello, traders! 🚀
A rare and powerful setup is forming on AUD/USD, and all signs are pointing decisively lower. 👇 This isn't just a simple technical pattern; it's a perfect storm of fundamental, technical, and event-driven factors aligning to create a high-conviction short opportunity.
If you're looking for a clean setup with a clear catalyst, this is it. Let's break it down! 🧐
The Core Thesis: Why We're Bearish 🌪️
This trade is built on three powerful pillars that are converging at the same time:
Massive Policy Divergence: 🇺🇸 vs 🇦🇺 This is the engine of the trade.
The Fed (USD): Remains HAWKISH 🦅. They are laser-focused on fighting stubborn inflation and have signaled they are in no rush to cut rates.
The RBA (AUD): Is actively DOVISH 🐨. They've already cut rates and are widely expected to cut again this week to support a weakening economy.
Result: This widening gap in interest rate policy creates a fundamental tailwind that heavily favors a stronger USD and a weaker AUD. 💸
The Dual-Catalyst Event (July 9th): 🗓️ This is the trigger.
FOMC Minutes Release: The minutes from the Fed's last meeting are expected to confirm their hawkish stance, reinforcing USD strength.
Tariff Deadline: A 90-day suspension of Trump-era tariffs expires on the same day . The base case is that tariffs will be reimposed, sparking a risk-off move in the markets.
Result: Risk-off sentiment is toxic for the risk-sensitive Aussie dollar (AUD) and a magnet for the safe-haven US dollar (USD). This is a potential double-whammy for AUD/USD. 💥
The Technical Picture is Screaming "Down" 📉
The chart tells a crystal-clear story of rejection and weakness. As you can see on the 4H chart, the price action is incredibly bearish after failing to break out higher.
The Great Wall of Resistance: Bulls threw everything they had at the 0.6590 - 0.6600 resistance zone and were decisively rejected. 🧱 This wasn't just any level; it was an 8-month high and a major long-term resistance area. A failure this strong is a huge red flag for buyers. 🛑
Momentum has Flipped: We saw classic bearish divergence on the higher timeframes, and as you can see on this 4H chart, we have now decisively broken below the recent rising channel. The path of least resistance has flipped from up to down. 👇
The Trade Plan 🎯
Here are the precise levels for executing this trade idea.
Asset: AUD/USD
Direction: Short (Sell) 📉
Entry Zone: ➡️ Look for a patient entry on a pullback to the 0.6535 - 0.6550 area. This was previous support and is now expected to act as strong resistance. We want to sell into strength.
Stop Loss: 🛑 A daily close above 0.6610 . This level is safely above the recent highs. A break here would invalidate our bearish thesis.
Target 1 (TP1): ✅ 0.6475 . This is the first logical support level. A good area to take partial profits and move your stop loss to break-even.
Target 2 (TP2): 🏆 0.6400 . This is our primary target, representing the bottom of the multi-week trading range and offering an excellent risk-to-reward ratio.
Conclusion: 💡
It's rare for fundamentals, technicals, and a major event catalyst to align so perfectly. The rejection at major resistance, combined with the powerful fundamental driver of policy divergence and the upcoming dual-catalyst on July 9th, makes this a high-conviction setup.
This is my analysis and not financial advice. Always do your own research and manage your risk carefully.
What do you think? Are you bearish on the Aussie too? Let me know your thoughts in the comments below! 👇
And if you found this analysis helpful, please give it a BOOST 🚀 and FOLLOW for more trade ideas! 👍

PRZ at 0.6600? | Watching for Reversal from Channel Top👆🚀Boost it if you like it... (Thank you) 🚀👆
Pair: AUD/USD Timeframe: 4H Bias: Short-term bearish Custom Term: PRZ (Possible Reversal Zone) = 0.65696
📈 Technical Structure:
AUD/USD is trading within a well-respected ascending channel, with price currently hovering near 0.6570. The upper boundary of the channel aligns closely with the PRP zone at 0.6600, which also coincides with:
A prior supply zone (visible on higher timeframes).
Confluence of the 15 EMA (0.65692) and 60 EMA (0.65534) flattening out.
Psychological round number resistance.
Entry: 0.65700
Stop: Above 0.66064 (channel breakout invalidation)
Target 1: 0.6540
Target 2: 0.6500
Risk/Reward: ~1.8
(Warning: This is an early entry )
🧠 Psychology Insight:
The PRP concept helps frame trades around areas of emotional overextension—where traders may overcommit to a breakout. By identifying these zones in advance, you stay objective and avoid reactive decisions.
PRZ: Possible Reversal Zone
#AUDUSD #PRZ #Forex #TechnicalAnalysis #ChannelTrading #ReversalZone #PriceAction #MJFX #TradingPsychology #ToughButSuccessful

Aussie H4 | Potential bullish bounce off a pullback supportThe Aussie (AUD/USD) is falling towards a pullback support and could potentially bounce off this level to climb higher.
Buy entry is at 0.6555 which is a pullback support that aligns with the 38.2% Fibonacci retracement.
Stop loss is at 0.6500 which is a level that lies underneath a pullback support and the 38.2% Fibonacci retracement.
Take profit is at 0.6598 which is a resistance that aligns with the 161.8% Fibonacci extension.
High Risk Investment Warning
Trading Forex/CFDs on margin carries a high level of risk and may not be suitable for all investors. Leverage can work against you.
Stratos Markets Limited (tradu.com ):
CFDs are complex instruments and come with a high risk of losing money rapidly due to leverage. 63% of retail investor accounts lose money when trading CFDs with this provider. You should consider whether you understand how CFDs work and whether you can afford to take the high risk of losing your money.
Stratos Europe Ltd (tradu.com ):
CFDs are complex instruments and come with a high risk of losing money rapidly due to leverage. 63% of retail investor accounts lose money when trading CFDs with this provider. You should consider whether you understand how CFDs work and whether you can afford to take the high risk of losing your money.
Stratos Global LLC (tradu.com ):
Losses can exceed deposits.
Please be advised that the information presented on TradingView is provided to Tradu (‘Company’, ‘we’) by a third-party provider (‘TFA Global Pte Ltd’). Please be reminded that you are solely responsible for the trading decisions on your account. There is a very high degree of risk involved in trading. Any information and/or content is intended entirely for research, educational and informational purposes only and does not constitute investment or consultation advice or investment strategy. The information is not tailored to the investment needs of any specific person and therefore does not involve a consideration of any of the investment objectives, financial situation or needs of any viewer that may receive it. Kindly also note that past performance is not a reliable indicator of future results. Actual results may differ materially from those anticipated in forward-looking or past performance statements. We assume no liability as to the accuracy or completeness of any of the information and/or content provided herein and the Company cannot be held responsible for any omission, mistake nor for any loss or damage including without limitation to any loss of profit which may arise from reliance on any information supplied by TFA Global Pte Ltd.
The speaker(s) is neither an employee, agent nor representative of Tradu and is therefore acting independently. The opinions given are their own, constitute general market commentary, and do not constitute the opinion or advice of Tradu or any form of personal or investment advice. Tradu neither endorses nor guarantees offerings of third-party speakers, nor is Tradu responsible for the content, veracity or opinions of third-party speakers, presenters or participants.

AUD/USD – Rejection at 2025 High?By: MJTrading
📉 AUD/USD – Rejection at 2025 High?
The Aussie is struggling at its 2025 high, printing successive lower highs (LH) and flirting with the 60-period EMA. With momentum leaning bearish, a short opportunity opens up near 0.64878, targeting the 0.64094 support zone. Confirmation from the EMA breakdown and rejection wicks strengthens the setup. Stop-loss above 0.65285 protects against a breakout trap.
Entry: 0.64883
Stop Loss: 0.65285
TP1: 0.64500
TP2: 0.64100
#Hashtags: #AUDUSD #ForexTrading #TechnicalAnalysis #ReversalSetup #BearishBias #LowerHighs #EMARejection #ShortThePop #PriceAction

Aussie H4 | Heading into a swing-high resistanceThe Aussie (AUD/USD) is rising towards a swing-high resistance and could potentially reverse off this level to drop lower.
Sell entry is at 0.6545 which is a swing-high resistance.
Stop loss is at 0.6571 which is a level that aligns with the 161.8% Fibonacci extension.
Take profit is at 0.6514 which is a pullback support.
High Risk Investment Warning
Trading Forex/CFDs on margin carries a high level of risk and may not be suitable for all investors. Leverage can work against you.
Stratos Markets Limited (tradu.com ):
CFDs are complex instruments and come with a high risk of losing money rapidly due to leverage. 63% of retail investor accounts lose money when trading CFDs with this provider. You should consider whether you understand how CFDs work and whether you can afford to take the high risk of losing your money.
Stratos Europe Ltd (tradu.com ):
CFDs are complex instruments and come with a high risk of losing money rapidly due to leverage. 63% of retail investor accounts lose money when trading CFDs with this provider. You should consider whether you understand how CFDs work and whether you can afford to take the high risk of losing your money.
Stratos Global LLC (tradu.com ):
Losses can exceed deposits.
Please be advised that the information presented on TradingView is provided to Tradu (‘Company’, ‘we’) by a third-party provider (‘TFA Global Pte Ltd’). Please be reminded that you are solely responsible for the trading decisions on your account. There is a very high degree of risk involved in trading. Any information and/or content is intended entirely for research, educational and informational purposes only and does not constitute investment or consultation advice or investment strategy. The information is not tailored to the investment needs of any specific person and therefore does not involve a consideration of any of the investment objectives, financial situation or needs of any viewer that may receive it. Kindly also note that past performance is not a reliable indicator of future results. Actual results may differ materially from those anticipated in forward-looking or past performance statements. We assume no liability as to the accuracy or completeness of any of the information and/or content provided herein and the Company cannot be held responsible for any omission, mistake nor for any loss or damage including without limitation to any loss of profit which may arise from reliance on any information supplied by TFA Global Pte Ltd.
The speaker(s) is neither an employee, agent nor representative of Tradu and is therefore acting independently. The opinions given are their own, constitute general market commentary, and do not constitute the opinion or advice of Tradu or any form of personal or investment advice. Tradu neither endorses nor guarantees offerings of third-party speakers, nor is Tradu responsible for the content, veracity or opinions of third-party speakers, presenters or participants.

AUDUSD - 4h |||Check this out for comprehensive analysis...
#AUSUSD #MJTRADING #FOREX #FXsignals #chart
