Another hawkish RBA hike, but will Jerome Powell turn AUD lower?Summary of the RBA’s February 2023 statement:
• The RBA hiked the cash rate target by 25 basis points to 3.35%
• Underlying inflation was above expectations at 6.9%
• Strong domestic demand is adding to the inflationary pressures
• CPI is expected to decline this year due to global factors and slower growth in domestic demand
• Medium-term inflation expectations remain well anchored, and it is important that this remains the case
• The labour market remains very tight
• Wages growth is expected to continue picking up due to the tight labour market and higher inflation
• The board will continue to pay close attention to labour costs and the price-setting behaviour of firms in the period ahead
• Further increases in interest rates will be needed over the months ahead
The RBA hiked the overnight cash rate by 25bp to 3.35% - its highest level since September 2012 – and warned of further increases in the months ahead. The two key words here are ‘increases’ and ‘months’, as it implies more than one hike over the coming months. And with rates at 3.35% it means the market pricing and consensus among economists for a terminal rate of 3.6% is not correct.
Given that the employment situation remains robust, inflation is higher than they expected and ‘strong domestic demand is adding to inflationary pressures’, we have several green lights for a hike in March and perhaps in May. Perhaps we’re closer to the elusive pause they teased us with last year, but I see no immediate threat of one in that statement.
And whilst the RBA expect CPI to decline as global factors and growth in domestic demands slows, what is going to happen if they do not slow quickly enough? Yep, more hikes. For now, a March hike seems like a done deal and I live in hope they hint at a pause, but I will not hang my hat on that given the data overall and strong levels of inflation.
AUD/USD 1-hour chart:
The Aussie bounce around 1% after the rate decision, but it is debatable as to whether it can retain its strength if Jerome Powell delivers a hawkish message overnight. The Fed’s rate remains above the RBA’s, with a higher expected terminal rate.
AUD/USD found support around the 50-day EMA and has since spiked higher, but bears may want to seek evidence of weakness around 0.6900 as it houses the monthly pivot point and broken trendline. Of course, should Powell fail to deliver the hawkish message, then it leaves AUD (and other FX majors) more wriggle room to unwind some of their post-NFP losses.
Aussie

AUD/JPY - Can the AUD outperform the JPY?COMMENTARY
The AUD seems to be gaining the most against the JPY compared to the following G10 Fx pairs including the NZD, CAD, EUR, and the USD in front of tomorrow's Reserve Bank of Australian (RBA) interest rate decision. High price action across the AUD cross pairs is expected upon tomorrow's RBA rate decision.
Current price for the AUD/JPY is above its 40 day moving average (bullish), MACD above its signal line (bullish), rate of change 13 day above its signal line (bullish); upside potential for a retest of the 92.8s provided price can remain above the 89.9 support; downside risk on break below the 89.9 support could position short sellers to target the 87.90 area.
Not investment advice. Past performance is not indicative of future results.

AUDUSD: Pullback From Key Level 🇦🇺🇺🇸
AUDUSD reached a key daily structure resistance.
The price formed a triple top pattern on that on 1H time frame and has just broken its neckline.
I think that the market will retrace from the underlined area.
Goals: 0.7096 / 0.7059
❤️Please, support my work with like, thank you!❤️

Joe Gun2Head Trade - AUDUSD looks ready to correctTrade Idea: Selling AUDUSD
Reasoning: Rallied into major resistance on the dialy chart. Smnall top on the 60min chart.
Entry Level: 0.7069
Take Profit Level: 0.6906
Stop Loss: 0.7122
Risk/Reward: 3.3:1
Disclaimer – Signal Centre. Please be reminded – you alone are responsible for your trading – both gains and losses. There is a very high degree of risk involved in trading. The technical analysis , like all indicators, strategies, columns, articles and other features accessible on/though this site is for informational purposes only and should not be construed as investment advice by you. Your use of the technical analysis , as would also your use of all mentioned indicators, strategies, columns, articles and all other features, is entirely at your own risk and it is your sole responsibility to evaluate the accuracy, completeness and usefulness (including suitability) of the information. You should assess the risk of any trade with your financial adviser and make your own independent decision(s) regarding any tradable products which may be the subject matter of the technical analysis or any of the said indicators, strategies, columns, articles and all other features.

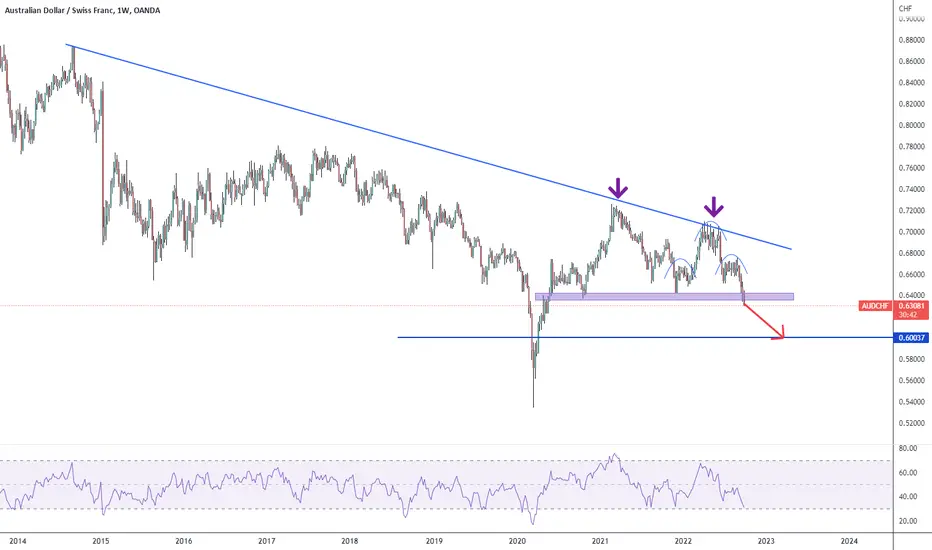
✅AUD_CHF POTENTIAL SHORT🔥
✅AUD_CHF is set to retest a
Strong resistance level above
After trading in a local uptrend for some time
Which makes a bearish pullback a likely scenario
With the target being a local support below
SHORT🔥
✅Like and subscribe to never miss a new idea!✅

Joe Gun2Head Trade - Major support on the daily EURAUDTrade Idea: Buying EURAUD
Reasoning: Major support on the daily, ending wedge on the 60min
Entry Level: 1.5324
Take Profit Level: 1.5520
Stop Loss : 1.5260
Risk/Reward: 3.02:1
Disclaimer – Signal Centre. Please be reminded – you alone are responsible for your trading – both gains and losses. There is a very high degree of risk involved in trading. The technical analysis , like all indicators, strategies, columns, articles and other features accessible on/though this site is for informational purposes only and should not be construed as investment advice by you. Your use of the technical analysis , as would also your use of all mentioned indicators, strategies, columns, articles and all other features, is entirely at your own risk and it is your sole responsibility to evaluate the accuracy, completeness and usefulness (including suitability) of the information. You should assess the risk of any trade with your financial adviser and make your own independent decision(s) regarding any tradable products which may be the subject matter of the technical analysis or any of the said indicators, strategies, columns, articles and all other features.

AUDUSD - Approaching overbought extremesRisk Disclaimer
The trade ideas beyond this page are for informational purposes only and do not constitute investment advice or a solicitation to trade. This information is provided by Signal Centre, a third-party unaffiliated with OANDA, and is intended for general circulation only. OANDA does not guarantee the accuracy of this information and assumes no responsibilities for the information provided by the third party. The information does not take into account the specific investment objectives, financial situation, or particular needs of any particular person. You should take into account your specific investment objectives, financial situation, and particular needs before making a commitment to trade, including seeking advice from an independent financial adviser regarding the suitability of the investment, under a separate engagement, as you deem fit.
You accept that you assume all risks in independently viewing the contents and selecting a chosen strategy.
Where the research is distributed in Singapore to a person who is not an Accredited Investor, Expert Investor or an Institutional Investor, Oanda Asia Pacific Pte Ltd (“OAP“) accepts legal responsibility for the contents of the report to such persons only to the extent required by law. Singapore customers should contact OAP at 6579 8289 for matters arising from, or in connection with, the information/research distributed.'
AUDUSD - Intraday - We look to Sell at 0.7160 (stop at 0.7200)
There is no sign that this bullish momentum is faltering but the pair has stalled close to a previous swing high of 0.7136. Daily signals for sentiment are at overbought extremes. This is negative for short term sentiment and we look to set shorts at good risk/reward levels for a further correction lower. Preferred trade is to sell into rallies. Although the anticipated move lower is corrective, it does offer ample risk/reward today.
Our profit targets will be 0.7045 and 0.6910
Resistance : 0.7135 / 0.7400 / 0.7660
Support: 0.6910 / 0.6770 / 0.6655

AUDUSD Moving Into Technical Resistance After CPIAUD is the mover of the day after CPI yoy jumped unexpectedly to 8.4% in Australia up from 7.3%. Thats big and can potentially mean that RBA will be foreced to raise rates further. AUDUSD is moving aggressively higher, but still trading at some key resistance levels here, with fifth wave. A lot of major currenices are trading at resistance vs USD, so if suddenly USD index would rally, then Aussie can come back down, but would most likely suffer less than others. From a longer term perspective we see AUDUSD clearly in bullish mode for much more upside, but ideally after a higher degree pullback.

This is going upThe pair is breaking through the strong resistance at 90.5 level. We may see some pullback and it would be an opportunity to buy more.

Joe Gun2Head Trade - AUDJPY into resistanceTrade Idea: Selling AUDJPY
Reasoning: AUDJPY into the neckline of a H&S top on the daily.
Entry Level: 91.382
Take Profit Level: 89.38
Stop Loss: 92.02
Risk/Reward: 3.13:1
Disclaimer – Signal Centre. Please be reminded – you alone are responsible for your trading – both gains and losses . There is a very high degree of risk involved in trading. The technical analysis , like all indicators, strategies, columns, articles and other features accessible on/though this site is for informational purposes only and should not be construed as investment advice by you. Your use of the technical analysis , as would also your use of all mentioned indicators, strategies, columns, articles and all other features, is entirely at your own risk and it is your sole responsibility to evaluate the accuracy, completeness and usefulness (including suitability) of the information. You should assess the risk of any trade with your financial adviser and make your own independent decision(s) regarding any tradable products which may be the subject matter of the technical analysis or any of the said indicators, strategies, columns, articles and all other features.

AUD/USD enters bullish trend before CPI release The Price Filter Indicator suggests that the AUD/USD has entered a bullish trend. The indicator has moved above the 0-line and turned green, which is a bullish signal with this indicator. This is the first time the indicator has entered green territory since April last year. The green surface area indicates that the trend reversal to the upside has momentum and could continue moving upwards.
This idea of a possible uptrend reversal is supported by the price hovering above the 200 EMA on the daily chart. This breakout above the 200 EMA period happened during the first week of 2023, signaling that this might be a good sign for the pair in terms of buying position.
With a current bullish bias, if AUD/USD closes above 0.69870, we might anticipate the price reaching 0.70600, filling out a previous wick's rejection. If the price has enough momentum in the upcoming days, we could expect the price to not only fill the wick to the left-hand side but also continue moving towards the 0.71200 area, which is the next possible resistance.
On the other hand, if the pair fails to break and close above 0.69870 convincingly, the price may bounce around 0.7000 psychological resistance and the 0.68850 support level until major fundamental news appears to dictate which way AUD/USD heads in the following days.
One such fundamental event will be the Q4 2022 Australian Inflation data due tomorrow (25/01/2023). The annual inflation rate jumped to 7.3% in Q3 of 2022 from 6.1% in Q2, beating expectations of 7.0%. Consensus forecasts for Q4 are for a modest rise to 7.4% or 7.5%, although some analysts are forecasting inflation to be 7.7% and above, pointing to recent data from UBS that showed supermarket prices rose an average 9.2% YoY in October-December 2022 up from the +8.2% recorded in the previous three months.

Buying Aussie against PoundThe pair just broke its strong support zone by formation of a huge bearish candlestick, indicating bears' control

EURAUD: Bullish Continuation Ahead! Your Plan: 🇪🇺🇦🇺
I spotted 2 important breakouts on EURAUD on a daily chart:
first, the price broke and closed above a neckline of a triple bottom formation,
then, the market violated a resistance line of a falling wedge pattern.
We see the retest of broken structures now.
I expect a bullish wave next week.
Goals: 1.578 / 1.5915
❤️If you have any questions, please, ask me in the comment section.
Please, support my work with like, thank you!❤️

AUD/USD coils up at the lows - 68c up next?A potential bearish continuation pattern is forming on the 4-hour chart around last week’s VPOC (volume point of control). RSI (14) produced a bearish divergence ahead of the selloff and remains below 50 to show negative momentum overall. Prices remain beneath the weekly and pivot point and monthly R1, so now seeking evidence of a swing high beneath those levels for a move down to 0.6850 and eventually the 0.6800 support zone.

Going short on AUDNZD A bounce back from major resistance and bearish momentum on heiken-ashi are a strong indication for going short in this pair

Buying Aussie against YenThe pair shows a series of higher highs and higher lows on a 15-minute graph

GBPAUD short triggered EOD stratA trend-following strategy that only takes a few minutes at the end of the day to set up and forget.
On the GBPAUD the shorts have been triggered and now we wait to see if we get to TP1 and a trend continuation.
Due to the initial stop being very wide, the risk per trade means the nominal lot size is very small.

Aussie in trouble, too bearish!Massive double top and HS just broke the weekly resistance. There is no other direction but to the downside. Just hold this trade a couple of months, wide stop loss, be patient the reward is big.
AU 12/01/2023AU NY trade, looks good to long until resistance higher up. DXY looking weak. Bare in mind CPI


Joe Gun2Head Trade - AUDCAD bias remains bearishTrade Idea: Selling LTCUSD
Reasoning: Swing failure
Entry Level: 0.92642
Take Profit Level: 0.91191
Stop Loss: 0.93077
Risk/Reward: 3.34:1
Disclaimer – Signal Centre. Please be reminded – you alone are responsible for your trading – both gains and losses. There is a very high degree of risk involved in trading. The technical analysis , like all indicators, strategies, columns, articles and other features accessible on/though this site is for informational purposes only and should not be construed as investment advice by you. Your use of the technical analysis , as would also your use of all mentioned indicators, strategies, columns, articles and all other features, is entirely at your own risk and it is your sole responsibility to evaluate the accuracy, completeness and usefulness (including suitability) of the information. You should assess the risk of any trade with your financial adviser and make your own independent decision(s) regarding any tradable products which may be the subject matter of the technical analysis or any of the said indicators, strategies, columns, articles and all other features.


AUDUSD SHORT: Sell-Off In ImpulseAUDUSD is showing considerable weakness signs.
The structure on the up-side since mid-December is Corrective.
A sell-off in a big degree is expected.
I am anticipating Intermediate (C) (red).
My Aussie technicals:
* Ending Diagonal in Intermediate (C) (white)
* Elliott Wave Reversal Pattern
* Upcoming Bearish Divergence
* Running Flat in Minor B (white)
* Double Top Pattern
* Supply Zone
* 161.8% Fibonacci Extension
AUDRUSD SELL Signal:
* Entry @ 0.69250
* SL @ 0.7100
* TP1 @ 0.6620
* TP2 @ 0.6455
* TP3 @ 0.6325
* Safety Measure: when in the green, moving SL to BE.
* SELL Stops on the way down, after pull-backs.
Many pips ahead!
Richard, the Wave Jedi.
