Aussiedollar
AUDUSD - 14/5/19Downtrending channel formation can be seen here. Once price shows good strong support off the lower trend-line, I'll be looking the go long. Other confirmations needed:
1. 1HR MACD divergence
2. Reversal price pattern
3. Strong candle close above (price must not break the trend-line).
GBPAUD HERE COME THE BEARS. SELL TRADEThe highs we are currently testING haven't been broken to the upside on higher timeframes since May 2016. After such a heavy bull reaching yearly highs again, we do need a push to the down side. Two target points initially for me are:
TP 1 - 1.8600
TP 2 - 1.84500
AUDUSD - Below 0.70Hi everyone,
It seems that the Australian dollar has broken significant support and keeps the focus lower in price.
I expect the AUDUSD to go lower around 0.68 for the following reasons:
1- US Dollar Index is on the Upside.
2-The weekly MACD looks bearish.
3- Bad news from the Reserve Bank of Australia.
4- No good news from China.
On the other hand, this could be a buy opportunity since there is a massive support at 0.70, however I do not think this will be the case this time.
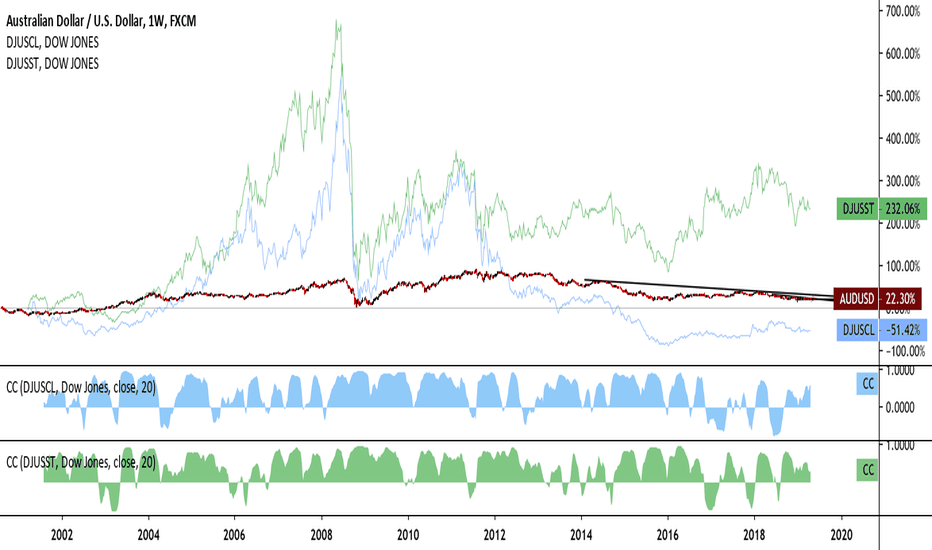
Correlations Between AUDUSD, Coal, and Iron OreI've been taking quite a deep look at the relationship between correlatives of the Australian dollar lately. There's no question that this deep dive would be remiss without looking at correlation coefficients between AUDUSD and that of commodities it exports, primarily iron ore and coal. The chart really speaks for itself. Aussie dollar sees strength when coal and iron prices are up, weakness when its down. Pretty simple. Not much more to say beyond that, but the implications for this relationship are quite fundamental to several questions vis-a-vis the Australian economy such as financial diversification, their reliance upon Chinese imports, not to mention the environmental tolls the Aussies have suffered from global carbon emissions. All issues, public policy or financial, must recognize this important financial relationship before going forward to reassess any changes to the economy that come down on it. At the very least, the implications of these correlations need to be recognized.
AUDCAD - Sell OpportunityCriteria:
1. Fibo retracement 62%
2. Fibo extension 161%
3. 2011 low
4. Previous 2019 high
5. The round number 0.96000
6. Channel projections
From a technical perspective, this level should be pretty strong, add here some fundamentals, etc.
Please, take a second and support my idea post by hitting the "LIKE" button, it is my only fee from You!
Have a nice week,
Best regards!
*This information is not a recommendation to buy or sell, it is used for educational purposes only!
AUDUSD Slow Decline DownwardStochastic flashes overbought while RSI is approaching this level. However, the Chaikin oscillator suggests there's some room to run higher. However, long-term 2018 downward trending resistance is a bit strong to overcome. Overall, sentiment is short, but need some more convincing as there is probably still more room to run upwards especially given the fact that moving averages point towards downward trending momentum.
Iron Ore AUDUSD Correlation DivergenceAUDUSD and iron ore have been quite tightly correlated over the years as it is one of Australia's number one exports. Now there is divergence which should be looked upon with high skepticism. Either the Aussie dollar will rise on the prospect of higher demand or the price of iron ore will retreat on the continue lack of demand if the supply side cannot remain limited.
Double Fib Levels Strong Support for AUDUSDTwo Fibonacci retracement levels come quite close to one another. The area around these double Fib levels have also acted as strong support dating all the way back into later 2018. Moreover, if price action retreats then we should probably see this same level act as support as it has been tested and retested several times. However, if price action moves to the upside, we could see that downward sloping short-term resistance to potentially hold.
AUDUSD - Northward bound to 0.8950After four years of a declining aussie dollar, and price reaching close to GFC levels, there has been a slow recovery.
Around mid 2016 price started to trend higher until the first quarter of 2018. There was that stop run again, during New Year 2019, to re-test the lows of 2016 and produce a double bottom.
This movement put price right into the buy zone on the weekly and daily charts. With the MACD confirming a divergence with price, I'm long with my first target of 0.8950.
If China Data is Weak, AUDUSD ShortThe relationship between the Aussie dollar and the Chinese economy is well studied. Clearly, Aussie dollar is a strong proxy for Chinese growth where economic figures should always be looked upon with skepticism. Overall, if the Chinese economy cannot get going, traders will first see this trend in the Aussie dollar.
AUDUSD Short on Fib Levels Trend Line Resistance Fib levels on the Aussie dollar have recently been interesting retracement levels with price action reversing at these price points. Technicals suggest a pullback, but could edge a bit higher before we see significant moves lower. Fundamentals also show downward movement BUT ONLY if Chinese growth continues to slow as the Aussie economy is probably the best exogenous proxy for Chinese growth. Vice versa, we can expect Chinese growth to pick up if data out of Australia is healthy. Overall though, my thesis is short, but is open to adjustment if the upward trend in data from China and Australia continues to show healthy growth.


