XJO - Monthly Candle - ABC Elliott Wave Correction Taking Place?XJO - We have what looks like a classic elliott wave correction taking place. At this point in time an XJO Elliott wave ABC correction is a higher probability than a V shape recovery. Will this play out, I have no idea.
Australia

AUDCAD What to Look Out For Going After the WeekendThe price is oscillating here between a zone of support and a zone of resistance. Going into the weekend these are the most important areas to look out for.
We can see that the price bound off the 0.5 fib level just now with a really strong green candle. In general there seems to be an upward move happening on AUDCAD with a small slowdown in the last few days.
I will give a bullish advice here, and expect that after a small retracement the price will break through the resistance.
Follow me for consistent high quality updates, with clear explanations and charts.
Please like this post to support me.
- Trading Guru
--------------------------------------------------------------
Disclaimer!
This post does not provide financial advice. It is for educational purposes only!

The 12 Apostles of Oil? (the future of “downstream assets")What is the future of the Oil Industry?
(A detailed study of Assets)
In the oil industry and in “the big-time” cooperate business “masters of business administration” "obese operations world" there is a term called “downstream”. Some companies get so chubby that they essentially dont need any of there sales stores that they actually sell their products in… in the oil industry a lot of companies “don't need gas stations” anymore so they “spin off” what is called their “downstream assets” and basically the gas stations are no longer part of the company. However, there is good and bad sides to this, it makes it easy to “own a McDonald’s franchise” but difficult to do anything “differently” or create “unique competition” with the financiers or the people that gave you the money. And the law is typically behind the “money” and not the people who own and run the businesses day to day.
For all practical industrial reasons ConocoPhillips (and perhaps all of the Earths Major Oil Operations) are not an American company or really “any specific” countries company. In fact the complexity of it all may minimizes a lot of the local legal business risks.
Perhaps one of the more interesting locations for “western” oil is 26 million square feet of “oil” headquarters in an area called the “Energy Corridor District” of West Houston Texas, The Energy Corridor is a business district in Greater Western Houston, Texas one of the largest cities in America and the location of many major “energy sector companies” operations including BP America, Citgo, ConocoPhillips, and Shell Oil Company and about 300 other smaller companies. Non-energy firms also have a presence including companies like Sysco and the largest company in the area is actually not involved with Oil originally they where a “former deep sea fishing company”.
Perhaps the most important strategic locations for ConocoPhillips is in the far north arctic and hot very very way way too hot Houston Texas. I was very surprised at how large the industrial complex was in the far north of Alaska. Before I knew almost anything about ConocoPhillips I was studying “the last and many of the most difficult road to find and get to on earth” and one of them was in the super far north of northern Alaska all the way up very near ConocoPhillips possible Oil Operations. Its one of the only roads in the far far north of Alaska that actually has google street view. One of the reasons I was interested in this place in particular is because Alaska is one of the “best places” on earth to go and “see the northern lights”. My friend told me about this place in the far arctic north of Alaska called “dead horse”… and she told me she use to drive up there when she lived in Anchorage sometimes to go and see the northern lights. She said that the northern lights up there come in all different types of colors. Alaska is one of the earths and Americas last “wild (natural and environmental) frontiers” if you even want to call it that? While I didn’t find any oil operations up there I did find a very small “remote” grocery store that apparently the only way to get food was by “air” and I was kinda interested in “shipping foods” (as a potential business opportunity and foods research) to strange an unusual places like the arctic and the thousands of islands in the deep pacific.
Perhaps the most “environmentally dangerous” locations that companies like ConocoPhillips operates are not on land where national governments can visit and carefully regulate and “help” oil operations but the most interesting and dangerous are deep at sea.
From what I’ve hearing from someone who works in the oil industry (as a friend of a really good geologist and person who likes to just study the earth for fun) on one of these oil platforms is that there is so much money involved that sometimes its like working on an “extremely dangerous pirate ship operation deep at sea” and its a very dangerous “man vs man” business in the deep sea “some people just don't come back” and the laws and rules are very different when your out in the middle of the sea… and especially on these deep sea oil rigs “if you talk too much… you might die…”?
Some of the most interesting and “dangerous” operations are located in a very unusual “side” of north western Australia near a town called “Darwin” Australia. Its rather different in Darwin and a remote northern side and even a little west of the “geological space needle” of Queensland Australia that points into the very large and indigenous “tribal islands” area of Asia Pacific Asia also known as the very special and mysteriously and extremely important geological island of “New Guinea”.
Unbelievably off the coast of Australia the company ConocoPhillips was able to essentially “buy” two, three actually 4??! entire fairly large “islands of gas” in the sea… These are not especially “deep waters” they are called “basins”. Two of these islands are called “Barossa and Caldita” in an area called BAYU-UNDAN in the “Timore Sea”… collectively these “islands of petrol gas and oil” are about 50 miles by 50 miles in total and they essentially “own them” through some type of “permits WA-315-P, WA-398-P and TP-28”? There is even a 200 mile “pipeline” in the middle of all this ocean essentially “shipping” the oil from BAYU-UNDAN all the way 200 miles back to Darwin Australia perhaps for “processing”?
If your interested in the details of how these pipelines work you should for sure take a look at the ConocoPhillips “fact sheet” from March of 2020 its very interesting to read the details about each location.
To work on these types of large oil projects many companies decrease their risk by working with other forging companies. Some of the companies Conoco Phillips is working out in the middle of the south east asian islands includes a lot of companies I’ve never known anything about but are probably very very large or at least have enough money and ability to get “deep sea permits” or make it look like its a “real” permit.
Co-Venturers include…
Origin Energy (40.0%),
PetroChina (20.0%)
Santos (25.0%),
SK Energy (37.5%)
Co-venturer: 3D Oil (25.0%),
Co-venturer: PETRONAS (40.0%)
Source: Conoco Phillips Corporate “Fact Sheet” March 2020 (PDF)
Whats particularly interesting to me as an amateur “arctic researcher” is that “most” or “many” of Conoco’s (easier) operations are located near very very unusual “polar arctic pivot points”. These are areas for example where you can see the “northern” lights a glowing light in the sky or where there is really good “arctic fishing” (like off the coast of Norway)
Whats interesting about this “American” company and perhaps many other oil companies is that 50% of all their employees (or technically they dont call them employees they say “payroll”) is say 17% Norwegen, 6% Indonesian, 7% Canadian, and 8% Australian (see website for latest details)
There are other very interesting “Conoco” locations off Tasmania … Tasmania is a very interesting point and its one of the most interesting islands on earth for really truly “cosmic” reasons. It “points” to the magnetic fields of the antarctic… For example if you use a “regular compass” on Tasmania the fields point “directly” to the south pole and the location of “magnetic pole”. This is a very very strange island and very very beautiful island too to the “southern magnetic field” or the “real” southern pole. If you have time for sure look up “ The Twelve Apostles” and take a look at the pictures… its an amazing natural wonder of the world that isn’t wildly widely known about. It maybe interesting to see if some of these oil companies might “invest” in building “lookout tours or tours” in the local naturalization parks to help people “see whats going on naturally”… See: Wikipedia "The_Twelve_Apostles_(Victoria)"
While there are other “oil” locations that Conoco + Philips is working another very interesting location related to the “magnetic fields” is at the “tail” of Argentina or what you might think of as the “connecting tail” of Antarctica to mainland “South America” (also known as Patagonia)? This oil “field” location is near (on on both borders of Argentina and Chile) its one of the most important famous and amazing “brilliantly” bright light blue melting glaciers. The pictures of this glacier goes on and on for as far as the eye can see and there is a strange “thawing mist” above the glaciers and strange bright blue ice burgs.
While I’m not going to focus on “all” the important operations they are ALL very very interesting to study. Because at one time these had a lot of “bio” mass or “fish”.
From a financial standpoint the oil rigs off the coast of Norway and in Northern Alaska maybe make the most sense and are the “safest” because they are “on land”. While the others located near the center of all the pacific islands and also “non great barrier” reef areas but “mini pacific island banks basin reefs” these are (Mystical places off the cost of Malaysia, Indonesia and Darwin Australia). These operations pose the most “public” environmental catastrophic risks to both the environment and the actual stock price. And if something goes wrong… few people know about it and yet all the fish know about it.
One of the most helpful projects Conoco is working on is actually located in Columbia. Columbia is not just “any country” in south America. Its the “center” of the “bridge” with north america and Central America. Columbia is the only country in all of south America with both Pacific Ocean and Atlantic Ocean “connections” and is “co sponsored” with another company called CNE Oil & Gas S.A. (20.0%).
The reason this project is so important to the rest of South America is because its helps with “real” international relations and is maybe the only time people there get to work with people in North America in something other then politics. A project like this also helps to bring “new wealth” to the country. However, Columbia is so important strategically that it maybe “the only hope” for stabilizing Venezuela with all of Central America and even preventing a “price war” over Oil with North America. Its not important to work with North America but it is important to work with modern x-drug lords soon to be “Oil Lords” of Columbia.
There are many possibilities of (neighboring) projects even though on a map these areas seem small and insignificant. Some oil “rigs” deep at see cost hundreds of millions of dollars to build and then suddenly sink for “no reasons”… Oil has the power to help develop “big industry” that might help organize other industry possibly including Nuclear Power. So what starts as a simple project in Columbia or even just “exploration” as they call it is VERY important even if its just a 50 mile by 50 mile “permit”.
In fact the oil discovered in Venezuela (suddenly became) the largest supply of oil on earth making sailing all the way to Saudi Arabia seem insane when you can sail from Houston to Venezuela almost over night. These projects with companies like CNE Oil & Gas S.A. (20.0%) are extremely complex and not necessarily “American” China and India has Oil needs too? This area of Columbia is “near” the “back door” to the amazon and a futuristic and yet “indigenous” high mountain cocaine tribal culture that may one day “have ideas that will blow everyones minds” about how to work with “natural resources”.
For now we dont know what oil companies are really trying to find in the “high mountain areas” like Columbia other then the worlds most important “new sexy hip” former “cocaine drug lords” towns like Bogotá and Medellín Columbia?
Anyway, I hope you have really enjoyed and learned a lot from this “story” of Conoco a company that an “American” oil company founded in 1875 as the Continental Oil and Transportation Co.
:)
Asher

AU10Y - Austrlian Bond Yields - lows aheadAustralian 10-Year yields seems to be tracing down intermediate wave 3. If this scenario holds yields could reach lower levels than 0.28. The critical levels are at the low of minor wave B when yields crosses down the odds are to this main scenario. If yields cross up 1.4, the alternative scenario where primary wave 5 has finished should hold. FOLLOW SKYLINEPRO TO GET UPDATES.


GOLD/AUD - $2,800 Fib Target Within SightQuick update on GOLD/AUD
We appear to be chugging along in a relatively undisturbed uptrend, the Fib extension targets from the April-August 2019 wave higher are pitching a potential point of resistance at the $2,800 mark as this coincides with the 1.27 extension. With a potential overshoot to just shy of $2,900 (based on Keltner channel targets)
Technicals:
~ Macd is bullish and is crossing above on the daily
~ Daily RSI appears to be congruent with the move higher, with no significant divergences, the monthly RSI however, is quite overbought at press time, but is confirming the higher highs
~ Price recently checked in with the 50 ma, so there is still ample room to move higher before a more substantial pullback
~ Price appears to be respecting the 21 ema
~ Looking to the monthly, price has come quite detached from the 10 period ma, suggesting that some mean reversion is on the cards, either by way of price falling, or a period of consolidation to allow the moving averages to catch up
Overall GOLD/AUD is performing very well and looks set to continue higher, at least to the $2,800-$2,900 range, at that point i would expect some selling pressure which could prove to be an ideal entry point
-TradingEdge

Aussie dollar - gann fanAustralian dollar, can be seen to be moving into a larger falling wedge. Nice buy.

ASX 200 truncated fifth? Why the Australian stock market fails
In my July 2019 analysis, I assumed ASX 200 was going through a Wave 3 and will go up to 8300 in a year. However, XJO failed epically, it did not even come close to the 1.618 projection at 8300, when the American stocks were strongly bullish. During the February and March 2020 corona virus panic, XJO dropped much more than Nasdaq Composite and some other American indexes. Comparing to American market, all those failures point to some underlying weakness in the Australian stock market and broad economy.
Another alarming fact is that the February 2020 all time high is 7180, right below the 3.618 projection of the 1982 to 1987 Wave 1 at 7200. In Elliott's Wave theory, Wave 5 often has some fibonacci proportionate relation with Wave 1. The Australian market is hinting here, February 2020 is the top of a truncated, 'failed' wave 5, as it failed to go significantly higher than the November 2007 top of Wave 3. If we take inflation into account, 7180 in 2020 might be actually lower than 6850 in November 2007.
Fundamentally, Australian stocks perform worse than their American counterparts because we have a crazy property bubble here, making many young and old Australians curb consuming and stock investing to save for mortgage deposits. My impression is that most immigrants or new Australians prefer to invest in real estate, not old fashioned shares. Australian immigration intake has been decreasing since 2017, corresponding neatly with the first wave of housing market crash. Unemployment caused by corona virus in 2020 make the rise in property prices since late 2019 look like a dead cat bounce, a Wave B. Unfortunately 2020 might be the start of a lost decade for Australia, featured with decreasing fertility, decreasing immigration, decreasing property and stock market, rising inflation, and collapsing Australian dollar. Indeed we are similar to the Japan of 1990, just awakening from decades of dreamlike growth, easy money and unrealistic confidence.
In the short term, ASX 200 is likely to try to approach 6000, getting close to 10 and 200 week moving average as resistance. This short term recovery will probably not change the bleak big picture though. My bottom line is that Australian market will drop more when the American market drops, and rise less when the American market rises, so overall Australian shares are much more bearish.

Australia - Watch for a Rally - Then Jump ShipLet's start with the broader picture first
I understand the market looks horrific at press time, but the first thing that you must know about markets is this, nothing every goes in one direction forever, no matter how bad it seems.
For context here are the three major US stock crashes.
2008 Crash
2000 Tech wreck
1929 Great Depression
The second thing that you must know is that a market will TYPICALLY, not always, but typically will retrace 50% of the first wave before continuing lower, as seen in the above charts.
In the most recent price action, this would entail a bounce to around 5400-5900, this is a prime opportunity to lighten exposure and prepare for another leg lower. Now, we may not get a bounce to the 50% fib level, but a move to the 38.2% is highly likely, at this point i would begin to lighten exposure and begin to buy shorting instruments, i.e. Puts.
Now, where do i see the potential low?
If the prior crashes throughout history are any gauge, then a top to bottom move of 50% is very likely, with the 1929 crash closer to 90%, i expect at worst we could see a middle ground, call it around 70%. This would be heavily dependent on Covid19 being far worse than governments are expecting, and a extended period of lock-down, which at press time, must not be discounted.
That being said, the first targets are a "typical" 50% move from the peak, as you can see, this would erase ALL gains from the past 20 years, taking the index back to levels first reached in 2001.
The third thing you must know about markets is that they go up in the long-term, emphasis on LONG-TERM.
After the 2007 peak, it took over 4,300 DAYS to retread those levels.
Do you have 12 years to wait?
Bear in mind also, this index is not inflation adjusted, if one inflation adjusts the index we never made new highs, in other words, it has been over 13 years and we are yet to make new highs.
What about Real Estate?
I have long maintained the Australian real estate market is a bubble, ready to burst, with valuations in some areas exceeding over 10:1 income to Value ratios (IVR), this was inevitable and the bubble appears to be finally bursting, so no, your equity in your house will not save you.
In fact, real estate priced in gold, is breaking out of a decade long slumber, what this means is that your home may gain nominal value, as governments feebly attempt to print enough money to cover the cracks, but your home will in reality be hemorrhaging real purchasing power.
Welcome to the word of relative values, where your house can both go up AND down in value, simultaneously.
In short, Australia has a weak economy, i have not even touched on the consumers and households overburdened with debt, the over reliance on the services industry as a primary source of GDP or the super fragile banking system, which by the way, have a huge number of "interest only loans" switching to principle and interest, over the next 18 months.
Hmmm... wonder how the general households will deal with those.
-TradingEdge
Interest only loans:
www.rba.gov.au

XJO - 50 EMA Strong Resistance Approaching!This rally has seen us nearly technically enter a bull market. The computers are out of control. I expect the 50 EMA to act as major resistance. High probability & a good time to sell some positions in longer term portfolios.

AUDJPY Bullish Continuation?Hi All,
I am intently watching the AUDJPY pair as we continue to coil up in this symmetrical triangle. This triangle is forming after a nice bullish divergence on the 1hr timeframe. Keep an eye on this pair as we enter the final stages of what looks like a bullish continuation pattern..
However, Australia have just announced a $130B stimulus package for business and employees struggling during the COVID-19 pandemic, what does this pair do from here?
Australia is due for the HIA New Home Sales report tomorrow morning so we could see this act as a moving factor during this crucial time for this pair, if we get negative news could we see the Aussie dollar lose value against the Yen?
Potential manipulation (bull trap) ahead..
Keep alert and trade safe!
--
MNLZ

WHC ASXLooking at WHC on a weekly chart
Price has come down into our buy zone
Price coming down into value low on VPVR and also sitting on the 786 fib
Internal indicators looking pretty good
All im waiting for is structure to come in on price
Potential 100% profit trade


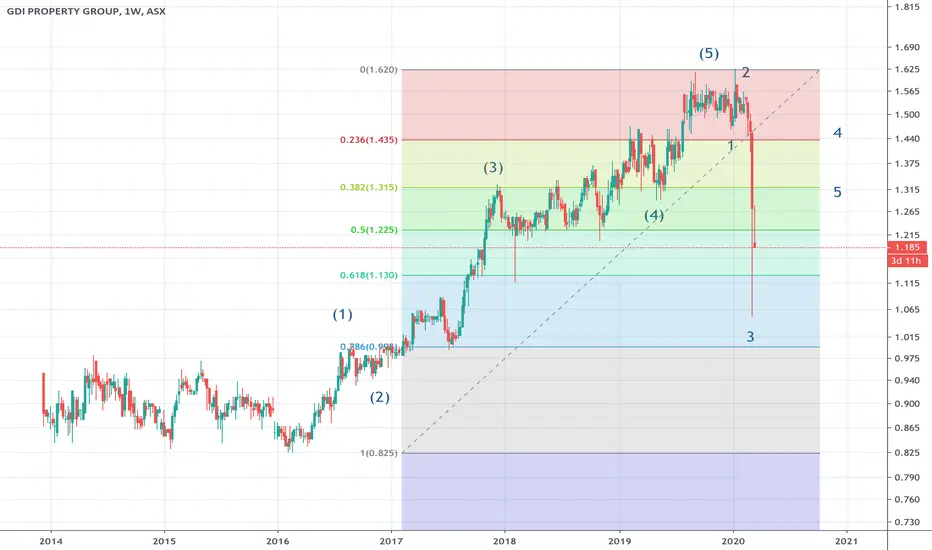
GDI Property Group is in Intermediate Wave A correction ASX:GDI
GDI is in the fourth minor wave of intermediate A and should show new decreases during minor wave 5 of A before a corrective retracement up in wave B.
Why the ASX200 is going lower (March 25, 2020)The COVID-19 pandemic has spurred on a catastrophic 39% decline over 5 weeks in the ASX200 .
Right now we're seeing the beginning of a bullish retracement as negative sentiments start to ease globally.
But with most market crashes historically, nothing ever falls in a straight line. There are always retracements in a down market, otherwise known as dead cat bounces.
This chart shows the ASX200 during the Global Financial Crisis ( GFC )
The full declines took an entire year and a half to play out
28 weeks in, the ASX200 had a 50% bullish retracement spanning 8 weeks.
Be careful (protect capital) - wait for a solidified foundation before going long - don't try to catch falling knives.

ASX All OrdiariesASX:XAO
XAO has been declining since the peak of cycle corrective wave b that happened earlier in the year. It seems to have finished primary wave 1 down and it is moving up in a 5 counter trend waves up that should create intermediate wave (A). The most probable target for the end of primary wave 2 up is at around 6300 points ASX:XAO when the retracement completes the fibonacci ratio of 0.618

Dark Times For The AUDLooking at my chart, it's clear that since the beginning of the chart to Dec '13 has been in an overall ascending wedge with two notable deviations.
One deviation in 2000 where a short sharp descending wedge took the AUD to the lowest point in 2001 before finally getting back to the ascending wedge by October 2003.
In 2008 it again briefly dropped during the GFC and quickly by 2009 returned to the ascending wedge pattern.
By 2013 the AUD begin descending and attempting to retest what was the support line of the ascending pattern.
From 2014-Now it's clear that the AUD is in a descending pattern and has broken through the support line on the Monthly candle.
Where it all goes from here depends on what the Australia Federal government can do, but with the fundamentals of Australia questionable I don't have high hopes.
What do I mean ? simply Australia is a wealthy country on paper, but the bulk of most peoples wealth is tied up in the value of their real estate, which has been inflated to insane levels due to access to cheap credit and very generous capital gains tax laws.
Most Australians are heavily reliant on overdrafts, credit cards, store cars, finance that most simply don't hoard that much cash.
Many people have gone and borrowed 100%+ the value of their properties, (I can assure you that bank valuers for real estate transactions are a fraud and they NEVER under value a property, it's an everyone wins game much like getting the real estate agent to recommend you a building inspector.)
Thing is that Australia outside of exporting it's mining resources, agriculture, tourism and education doesn't actually produce or make much anymore, much of the economy revolves arounds services.
Given current events with the Coronavirus epidemic and global shut down, this is going to paralyze the Australian economy if it continues for long.
Back in 2008 Australia was fortunate to have a cash reserve to weather the storm, this time around they are far more vulnerable with the national wealth build on a house of cards.

AUDJPY Probabilities Price DirectionThis is an easy game to know how the global pandemic isn't settled yet and knowing how all big central banks honchos cooperated together to fight against this pandemic by deciding to lower OCR rates equally to combat against the corona virus. State & Europe are new continents who are for now struggling and combating strongly against this pandemic. I hope they win this battle soon but for now, commodities are hampered badly it seems a pity moment to even know how badly supply chain distortion has ruin commodities overall. Comdolls have very fewer probabilities at this hard period of time to even think that they may rise back. They need some pure remedy like " vaccine development " good reports to bring back optimistic. The move upward may only be some correction or retracement on price but it will be hard to think if it is an overall reversal in trend. We all know oil has been the most interesting commodity lately and knowing how it heavily plunged due to the pandemic case so I have not much good faith over comdolls bullish sentiment at least for now. One interesting thing which I would like to talk about is how New Zeland trying to combat strongly lately knowing how it cuts the rate below RBA (which was emergency cut in the weekend, Sunday) seeing that RBA has still room, for now, to get equal to its neighboring country which probably is a case market participant may price in lower for further remaining rooms for cuts (still 0.25 bp room left comparing to other). And lastly, how could I close my idea without mentioning our China which plays the main role over this global pandemic case. If you knew the more china in hurt or the escalation of spreading the virus rate and death counts then remember it will equally hurt Australia and Newzealand businesses as well so keep in that mind. Be sensitive over global risk news updates. This is all some beyond technical analysis thoughts from my side to this pair and if you find this idea valuable don't forget to support me with providing a thumps up! Peace :)

XJO monthly and weekly levels.Keeping it simple.
Monthly resistance @6618--> next test: More outbreaks, Geopolitical tensions, Lower forecasts, supply chain issues, Profit taking, Uncertainty
Strong support @6380 --> Thanks to : helicopter money(eg- Hong Kong), Interest rate cuts, ' Buy the dippers' .
Not a trader(yet). Purely sticking to fundamentals of the companies I own/want to own.


Austral Gold: Junior's Time to ShineLooking at Junior Gold as the next big market to trade, obviously due to rising gold and silver prices, but I like this company for a few reasons. Obviously being in South America the local currencies are trash (EM FX at record lows) so costs will likely remain low, especially if oil remains relatively cheap. Recently margins have begun to grow due to rising gold and I think there are companies like Austral that are in an interesting position because they are too small to be bought buy the large ETF's due to their purchase rules, yet they are unlocking significant value for shareholders. Currently the company is raising capital for drilling/exploration activities at their existing mines at $0.08 offering only to existing shareholders, so I don't think the dilution will really hit the market.
I think this offers a trade opportunity with an interesting risk/reward profile. As long as this negative-interest bond madness continues we can expect gold to continue rallying higher, which means the margins at the miners will swell! ETF's can't touch these until they get bigger so the time to aquire shares is now before the gold market as a whole is revalued much higher than it is today.
Highlights:
- Existing Guanaco/Amancaya operations providing cashflow near Yamana Gold's El Penon deposits ( June 2019 AISC < $1000, gold at over $1500 currently)
- Exploration potential in both Chile and Argentina (existing reserves assayed at $1300 Gold)
- Rising silver prices while Casposo silver operation on-hold (reserves in ground gaining value)
- Austral can produce lots of silver, meaning a big drop in the gold/silver ratio will leverage the margin expansion faster than gold producers alone.
The company has some debt, which obviously poses a hurdle, but repayments are going well with the recent increased cashflow. Mineral reserves need to expand so expect drilling and associated costs, there is a deal offering to existing shareholders to fund drilling this year.
Looking technically there have been 2 other historic buying opportunities at these levels, and the market seems to be close to a potential breakout of the falling wedge pattern. If you zoom in on the last year the stock has traded in a range and despite the thin volume there is a potential cup + handle formation holding just below the 0.09 level. I'm obviously bullish and have a long position.
Please comment if you have any thoughts on AGD/AGLD. GLTA.

GBPAUD Selling momentum will continueas described with chart please use proper money management due to high pips SL. Have A nice day!

Australian Equities Unwind We're calling it.
Australian Equities have now recovered losses stemming from the 2008 Subprime Crisis sell off and are now at ATHs supported by large corporate buybacks amidst moderate earnings growth.
Our view
- Weaker relative EPS on the back of domestic bushfires, lowered Chinese demand and corporate buyback continuity.
- Lowe & Co running out of monetary stimulus and room to push asset prices higher. We see an unwind on any hawkish commentary out of the RBA.
We see weak price momentum and signs that price is now overbought and due in for a positional correction.
We have added sellside exposure across both our macro and directional portfolios
-------------------------
We look forward to continuing to provide market leading analysis to traders & investors alike across the TradingView platform.
Like, subscribe and leave your comments below!
Until next time,
Portier Capital
Macro Strategy & Portfolio Management
