S&P 200 bigger picture: Up to 6800 before going down to 4500ASX 200 started a new five Elliott wave structure after the completion of correction in Februrary 2009. It has since completed four waves on a monthly scale and is now running upwards in its fifth wave which is likely to terminate around 6800 and go down to around 4500.
Why do I think so?
If we zoom in in the period from February 2016 when the fifth wave started, you would see that ASX 200 has already completed four waves on this weekly timescale (green waves) and is now completing the fifth wave which started in February 2018. Also see a chart copied below.
If we further zoom in the period since February 2018 by going to the daily scale (see below - pink waves), you would notice that ASX 200 has completed two waves and is now running in the third wave. The five waves on the daily scale are likely to be completed by 6800.
Further, 6800 is the top of the bullish channel started in 2008. Also, it is the value of the previous top before the financial crisis which is expected to offer significant resistance.
What would be the correction target?
If the correction is 61.8% then it could take ASX 200 down to 4500, but of course, it also depends on the level from which ASX 200 starts correction. If the correction is up to 78.6%, then ASX 200 will drop to 4000.
When is the correction likely to start and end?
It is difficult to say but I expect the correction to start in Nov-Dec 2018 and to complete by Jan-Feb 2020.
Is there light at the end of the tunnel?
Yes, this entire wave started in 2009 and completing in Feb 2020 would just be the first cyclic wave. After its completion, ASX 200 is expected to start the third bullish cyclic wave which could run for many years and could take ASX 200 up to around 10,000.
Weekly chart
Daily chart
Note: It is not a financial advice. Please trade at your own risk.
Australia

MYER - ASX - LongLooks very interesting recovery in process for myer. Fundamentals with restructuring looks good and people seem to be a tad bit more confiden. Target #1 should be around 80cents.

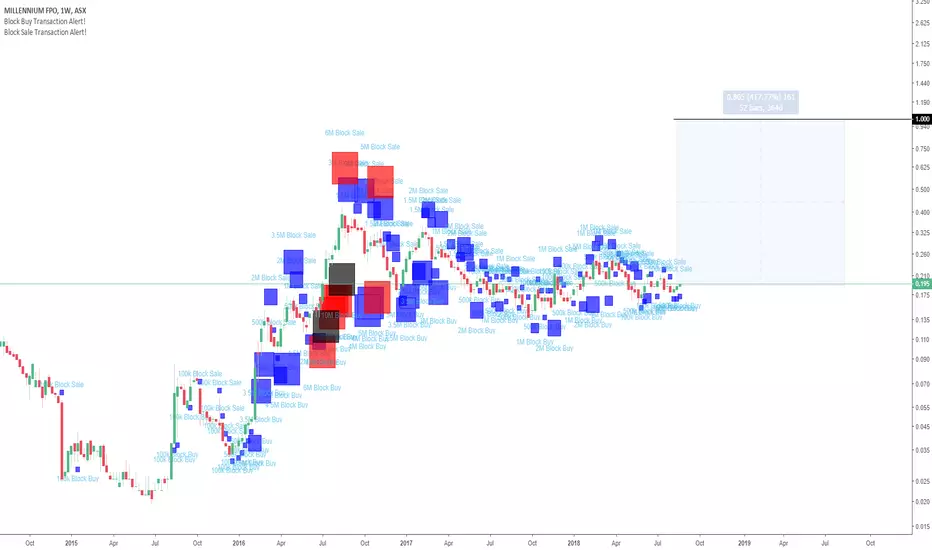
ASX:MOY Institutional Investment Millennium Mining is very well run and operated. Institutions around Australia have weighed in on the success of this company and the stock price is set to soar as retail realises they are sitting on the sidelines. Conservative figures put this stock well over the dollar mark within the next year (large returns).
Spot price gold has also experienced an over-extended slump, leaving ASX:MOY nothing but positive news ahead.
Australian Stock Index ASX (Aug 2018) *PULLBack time!This will be my views of Australian Stock Index ASX (Aug 2018)
Please make sure to read the "update" comment as there will be changes along the way.
Cheers.
S0nic
Disclaimer:
The information contained in this presentation is solely for educational purposes and does not constitute investment advice. We may or We may not take the trade.
The risk of trading in securities markets can be substantial. You should carefully consider if engaging in such activity is suitable to your own financial situation.
We, Sonicr Mastery dot com is not responsible for any liabilities arising from the result of your market involvement or individual trade activities.
You should be aware of all the risks associated with foreign exchange trading, and seek advice from an independent financial advisor if you have any doubts.

15 TTf Box Strategythe price already break the box now pull back
go long aim 2R
why have to complicated


BHP Billiton vs. CommoditiesComparing BHP billiton to Gold, Copper, and Oil - aka the "reflation" commodities. Note how there is a decent correlation that has completely diverged in the past few months. Billiton probably going to head downward

Correlation & recent divergence of Australia & Hong KongInteresting divergence in the past few months in what are normally two highly correlated indexes (Hong Kong's HSI and the Australian index). Hong Kong is the red line, whereas Australia is the blue line. Note the stark divergence where HK is heading south, while Australia has yet to head downward.
Note that the lines represented here are the 100-day exponential moving averages of the index to smooth things out.

Simple as 123 15mins BOX strategy
buy if the price break above,
Sell if the price break bellow
1R : 1R
Simple right


Short ASX - Recession inboundASX topping out, creating multiple bear divergences within a large, multi year bear flag.
Orange line = height of ASX pre gfc.
Red line = pre recession support
Blue lines = first lot of targets.
Along with the housing bubble, potential future issues with loan repayments (i.e. those who took out interest only loans), along with the flat cash rate and wages not meeting inflation and gosh so many other things, Australia's recession may occur in 2019 with major repercussions in 2020.
I am not a financial advisor or some analyst of any kind. Just a guy who's interested in macro-economics. Whether I am right or wrong, it would be very interesting watching the next 2-3 years unfold.

Time to Long TELSTRALooks like we bout to hit bottom. This should be a good place to go long. If it breaks down more, then you can always bail at a stop loss, but this right here is a seven year low. With the recent job cuts and 5G around the corner, I fully expect a rebound.
Also every single analyst right now is telling you to sell. Thats a buy signal in itself.


Australian Cannabis Penny Stock: MCLAustralian Cannabis Penny Stock:
market looks a little over extended leaning towards overbought. Massive accumulation phase before huge pump cycles. Market is over 200 sma bullish, Retest of 618 fib expected, if successful bounce from 618 support and break threw ichimoku cloud, then enter a long position, marker will be confirmed bullish.
For best entry wait until we retest yellow support trend line.
Good news could easily see us propelled to 0.26+ continuing bullish trend


