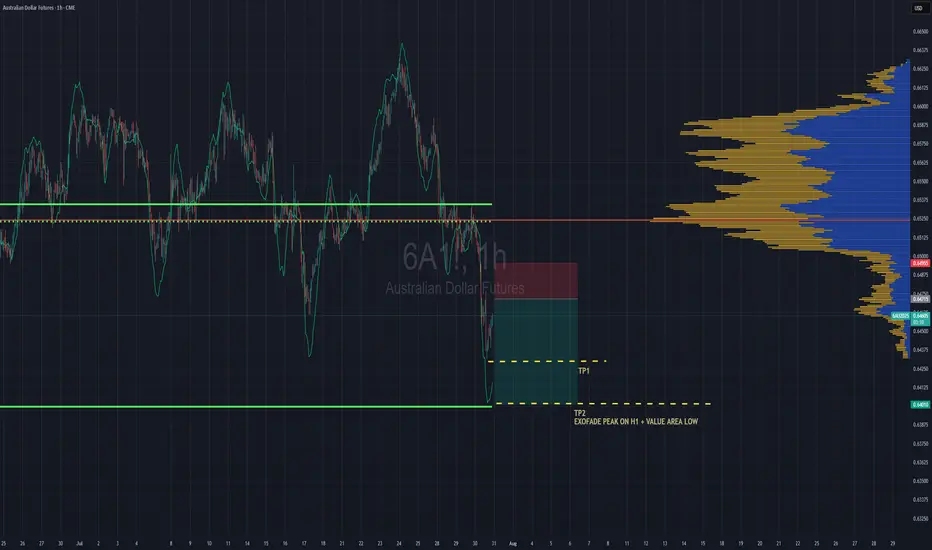
Aussie Shorts Looks Promising This is a pullback trend trade anticipating trend continuation. Entry is based on LVN (low volume node) for entry. Also looking on the footprint chart there is a high volume node with -ve delta that was traded at 0.64715.
If the sellers return to defend that price then this pullback should give some strong rejection once we pierce the entry zone and send bulls packing.
TP1 - First swing low
TP2 - Value area low of the range, which also is in confluence with the ExoFade peak on the 1HR timeframe. ExoFade peaks always gets taken out in a strong trend, that's why i love using them as price targets for exits. ExoFade is free on Tradingview for those curious about it. Just search for it.
Australiandollar
AUSSIE BANK ROBBERY: AUD/USD Bullish Breakout Confirmed!🔥 AUD/USD BANK HEIST: The Ultimate Bullish Robbery Plan (Thief Trading Style) 🔥
🌟 ATTENTION, MONEY MAKERS & MARKET ROBBERS! 🌟
💸 MISSION BRIEF:
Based on Thief Trading Style (technical + fundamental analysis), we’re executing a bullish heist on AUD/USD ("The Aussie")—time to steal those pips like a pro!
📈 ENTRY STRATEGY (The Heist Begins!)
Long Entry Trigger: Wait for Dynamic Resistance MA crossover + candle close above 0.65300 (bullish confirmation).
Pro Tip: Use Buy Stop orders above MA or Buy Limit orders on pullbacks (15m/30m timeframe).
🔔 SET AN ALERT! Don’t miss the breakout—alert up, gloves on!
🛑 STOP LOSS (Protect Your Loot!)
"Yo, rookie! 🗣️ If you’re entering on breakout, DO NOT set SL before confirmation!
📍 Thief SL Placement: Nearest 4H swing low (0.64800)—adjust based on your risk, lot size, & trade multiples.
⚠️ Warning: Deviate at your own peril—your risk, your rules!
🎯 TARGET (Cash Out & Run!)
Take Profit Zone: 0.65800
Scalpers: Long-only plays! Use trailing SL to lock profits.
Swing Traders: Ride the wave—big money moves require patience!
📰 FUNDAMENTAL BACKUP (Know Why We Robbin’!)
Bullish momentum fueled by macro trends, COT data, sentiment shifts.
🚨 Breaking News Alert: Avoid high-impact news spikes—trail SL or stay out!
💥 BOOST THE HEIST!
Hit 👍 LIKE, 🔄 SHARE & 🚀 BOOST—strengthen the robbery squad! More heists = more profits!
🤑 NEXT HEIST COMING SOON… STAY TUNED! 🐱👤

AUDUSD Strong bullish momentum inside this Channel Up.The AUDUSD pair has been trading within a 3-month Channel Up pattern and on Monday almost hit its 1D MA50 (blue trend-line) and rebounded. This is the start of its new Bullish Leg.
Based on the previous ones, it should complete a +2.70% rise at least. As long as the 1D MA50 (blue trend-line) holds, we are bullish, targeting 0.66555.
-------------------------------------------------------------------------------
** Please LIKE 👍, FOLLOW ✅, SHARE 🙌 and COMMENT ✍ if you enjoy this idea! Also share your ideas and charts in the comments section below! This is best way to keep it relevant, support us, keep the content here free and allow the idea to reach as many people as possible. **
-------------------------------------------------------------------------------
Disclosure: I am part of Trade Nation's Influencer program and receive a monthly fee for using their TradingView charts in my analysis.
💸💸💸💸💸💸
👇 👇 👇 👇 👇 👇

Quiet Before the Move — What AUD Options Are Telling UsThe AUD is stuck inside its recent range — trading has gone sideways, and trying to predict a breakout direction ahead of key moves would be premature (for more on the “Suffering Trader” concept, click here ).
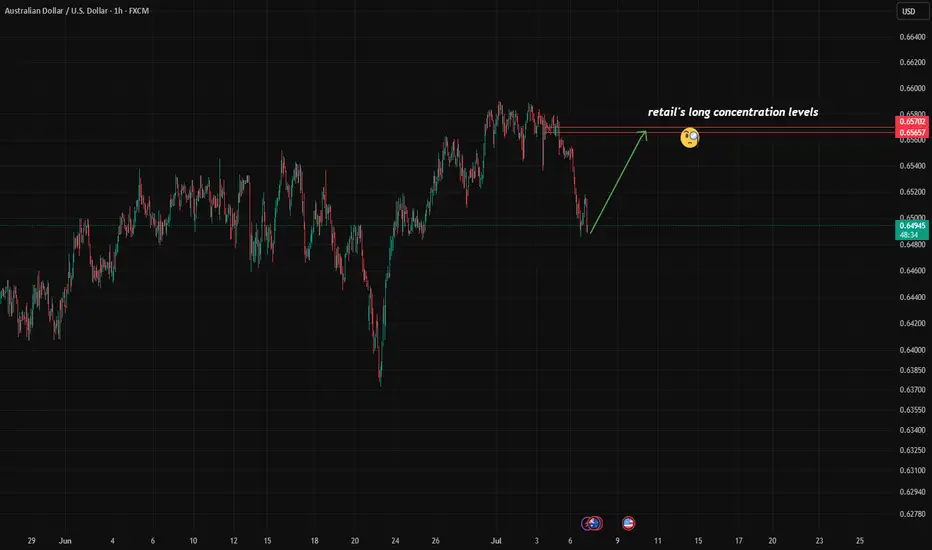
Price is consolidating just below a cluster of previously opened retail longs. This "failure to achieve" undermines the case of shorting this level right now. So for the time being, I’ll stay in observation mode and watch which side ends up suffering the most.
Now, looking at the CME data , there’s been a meaningful inflow in deep-out-of-the-money call options at the 0.665 strike . That’s interesting.
Also worth noting: just above, at the 0.67 strike , we saw a similar inflow a couple of days ago — and that portfolio remains static. No repositioning or outflows so far.
That silence could mean something. Or nothing — yet.
We’re watching closely.

Market Analysis: AUD/USD Attempts Fresh ClimbMarket Analysis: AUD/USD Attempts Fresh Climb
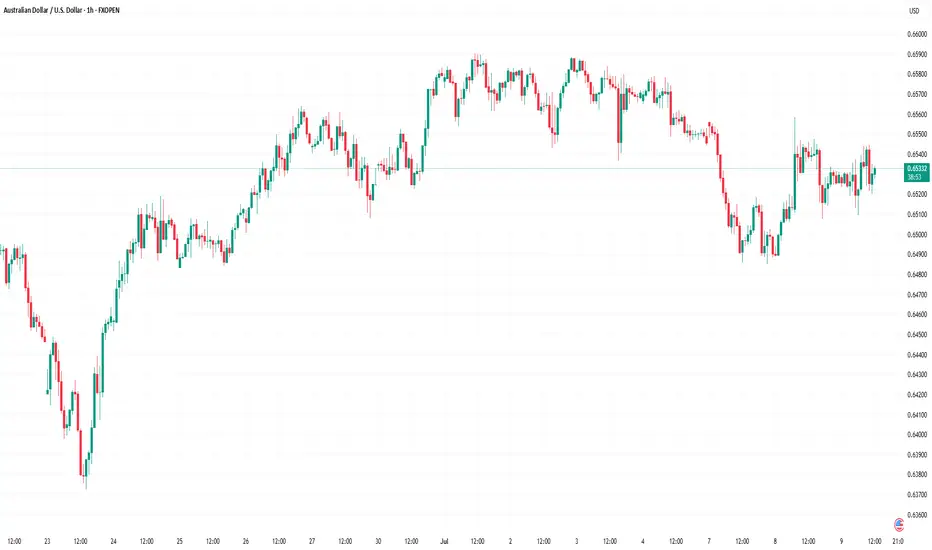
AUD/USD is attempting a fresh increase from the 0.6485 support.
Important Takeaways for AUD/USD Analysis Today
- The Aussie Dollar found support at 0.6485 and recovered against the US Dollar.
- There is a key bearish trend line forming with resistance at 0.6535 on the hourly chart of AUD/USD at FXOpen.
AUD/USD Technical Analysis
On the hourly chart of AUD/USD at FXOpen, the pair started a fresh increase above 0.6550. The Aussie Dollar tested the 0.6585 zone before the bears appeared and pushed it lower against the US Dollar.
The pair declined below the 0.6560 and 0.6550 support levels. The recent low was formed at 0.6485 and the pair is rising again. The bulls pushed it above the 50% Fib retracement level of the downward move from the 0.6588 swing high to the 0.6485 low.
The pair is now consolidating above the 50-hour simple moving average. On the upside, the AUD/USD chart indicates that the resistance is near the 0.6535 zone. There is also a key bearish trend line forming at 0.6535.
The first major resistance might be 0.6550 and the 61.8% Fib retracement level. An upside break above it might send the pair further higher. The next major resistance is near the 0.6560 level. Any more gains could clear the path for a move toward the 0.6585 resistance zone.
If not, the pair might correct lower. Immediate support sits near the 0.6510 level. The next support could be 0.6485. If there is a downside break below 0.6485, the pair could extend its decline toward the 0.6440 zone. Any more losses might signal a move toward 0.6420.
This article represents the opinion of the Companies operating under the FXOpen brand only. It is not to be construed as an offer, solicitation, or recommendation with respect to products and services provided by the Companies operating under the FXOpen brand, nor is it to be considered financial advice.
Contrarian Alert: Retail Is Buying, But Should You Sell?So far, there are no significant changes in the options flow suggesting a shift in sentiment or restructuring of previously established bullish positions. The market remains on watch, but interesting signals are coming from other sources.
According to the latest COT reports , institutional players continue to align with the current trend, reinforcing its stability.
However, retail positioning is starting to show signs of a potential reversal , with a noticeable increase in net-long positions and fresh buying activity over the past two days. This often indicates early countertrend interest.
The well-known contrarian principle — "do the opposite" — applies here, although it shouldn't be taken as an immediate signal to short.
For my part, I’ve identified the 0.6565–0.6570 zone as a key level where long positions are concentrated:
A rejection from this zone could offer a solid shorting opportunity.
A break above it would suggest the trend might resume higher.
By that point, updated options flow data and new positioning COT reports may provide further confirmation.
Trading the July RBA decision The Reserve Bank of Australia (RBA) will deliver its latest policy decision on Tuesday, 9 July. Markets are heavily positioned for a 25-basis point cut, which would bring the official cash rate down to 3.60%.
Major Australian banks including CBA, Westpac, NAB and ANZ are aligned in expecting a cut this month, with some anticipating further easing in August and November. A confirmed cut paired with dovish guidance could place further downside pressure on the Australian dollar, particularly against the US dollar and Japanese yen.
AUD/USD remains capped below the 0.6580–0.6600 region, with repeated rejections suggesting strong overhead resistance. A break above this zone would be needed to shift momentum higher. Conversely, a confirmed break below 0.6520 could open a move toward the 0.6450 area. Meanwhile, AUD/JPY has rebounded firmly off its May lows and is now testing resistance near 95.30. This area has repeatedly capped upside since mid-June, making it a key level to watch into the RBA decision.

AUD/USD: The Rebound TradeThe Australian dollar (also known as the Aussie Battler) looks set to continue its recent bounce. Inflation is now under control and monetary easing will continue to support aggregate demand across the economy. While rate cuts are dovish, the underlying economy is still strong and, as we will explain below, the fiscal situation is shaping up better than expected. Stability is in.
The real action, though, is in the US. Unemployment is creeping up. Jobless claims are ticking higher. Existing home sales are falling. The US consumer is feeling the pinch. That puts pressure on the Fed. Rate cuts are back in the conversation. Markets are already pricing in the first move later this year. The US dollar is losing its grip.
AUD/USD recently tested its 200 day moving average and held firm. That’s more than just a technical level. It’s a psychological line in the sand. The Aussie held its ground.
There’s more. Australia’s fiscal position is likely to come in stronger than expected. Mining exports are holding up. Volumes are rising. That supports the budget bottom line and underpins the Aussie’s credibility as a resource backed currency. This is in stark contrast to most of the developed world, where peers are running large deficits.
This isn’t just about central banks. The global economy is shifting gears. China is stabilising. Industrial demand is returning. Commodity prices are finding a floor. That’s key for the Aussie. It’s still a commodity linked currency. As iron ore and copper pick up, the AUD should follow.
There’s a window here. Over the next twelve months, the AUD has room to move higher, testing the 0.7000 range. Not because Australia is booming, but also because the US is slowing. The Fed is running out of steam. That flips the dynamic. We’re moving from USD strength to USD softness.
The setup is clear. A soft landing in the US. A stable China. Commodities firming. And an RBA on hold. That’s a cocktail for AUD strength.
The bounce has just begun.
The forecasts provided herein are intended for informational purposes only and should not be construed as guarantees of future performance. This is an example only to enhance a consumer's understanding of the strategy being described above and is not to be taken as Blueberry Markets providing personal advice.

AUDJPY: Sell opportunity.AUDJPY is basically neutral on its 1D technical outlook (RSI = 56.422, MACD = 0.430, ADX = 19.989), ranging inside the 1D MA200 and 1D MA50 since the start of May. The last bullish wave top of the Channel Down got rejected around those levels and targeted the S1 Zone. Short, TP = 90.150.
## If you like our free content follow our profile to get more daily ideas. ##
## Comments and likes are greatly appreciated. ##

AUS200 UNDER ATTACK: TRADERS RAID THE TREND!🔥 Australia 200 HEIST: STEAL THE TREND LIKE A MARKET BANDIT! 🚨💰
Locked & loaded for the AUS200 (Australia200 Index) heist? This slick blueprint cracks the code to loot profits—blending killer technicals with macro intel. Ride the bullish wave, but dodge traps near the Overbought Zone. Bears lurk, so secure your bag before the reversal hits! 🐻💨
🎯 ENTRY: STRIKE LIKE A PRO THIEF
Long the breakout near 8430.00.
Set stealth alerts to catch moves in real-time. 🕶️🔔
🛡️ STOP LOSS: ESCAPE ALIVE
Hide stops under the last 2H swing low/wick—no reckless bets!
Adjust for your risk—survivors play smart. ⚡
💸 TAKE PROFIT: VANISH WITH THE LOOT
Main Target: 8650.00 (or bail early if momentum fades).
Scalpers: Trail stops & ghost out with quick wins. 🏃♂️💨
📡 WHY THIS HEIST WORKS
Australia 200’s on fire: Fundamentals + COT data + macro tides align.
Sentiment’s bullish, but stay sharp—links below for the full intel. 🔍🌐
⚠️ WARNING: NEWS = POLICE SIRENS
Avoid new trades during high-impact news. 📢
Lock profits with trailing stops if you’re already in. 🔐
🤝 JOIN THE TRADING MAFIA
Smash LIKE, drop a comment, & let’s dominate the AUS200 (Australia200)! �
Ready for the next big move? Stay tuned. 👀
Happy hunting, chart pirates! 🏴☠️📉

AUDUSD: weekly analysis Jun 1, 2025 – Jun 7, 2025Trump administration makes traders follow trades every single political news. Unpredictable about everything, if I want to describe the U.S president in one phrase. one day he decides to reduce tariffs, the other day he increases. One day wishes a good future for Iran, the other day he threatens Islamic republic with bombing. The same story with Russia, China and everything expects the Crypto. Okay let's get back to Aussie! any good news about China-Australia relations will increase the AUD.
The other important news this week is quarter to quarter GDP of the land of kangaroos.
After all, taking a look at weekly chart! A bullish week is more possible
*******************************************************************
The indicated levels are determined based on the most reaction points and the assumption of approximately equal distance between the zones.
Some of these points can also be confirmed by the mathematical intervals of Murray.
You can enter with/without confirmation. IF you want to take confirmation you can use LTF analysis, Spike move confirmation, Trend Strength confirmation and ETC.
SL could be placed below the zone or regarding the LTF swings.
TP is the next zone or the nearest moving S&R, which are median and borders of the drawn channels.
*******************************************************************
Role of different zones:
GREEN: Just long trades allowed on them.
RED: Just Short trades allowed on them.
BLUE: both long and short trades allowed on them.
WHITE: No trades allowed on them! just use them as TP points

AUD/USD: Bullish Reversal Expected From 0.6430 Support The AUD/USD 15-minute chart reveals a potential bullish reversal setup forming near the 0.6430 support zone. Following a clean Break of Structure and prior Inducement, price action is now testing a minor demand zone marked by a blue box. This level coincides with a sweep of short-term lows and rejection from the lower boundary, indicating a possible accumulation phase. The descending trendline has already been breached, suggesting weakening bearish momentum.
Traders may look for a long entry around 0.6430–0.6435, targeting the key resistance level at 0.6466, which aligns with a previous supply area and structural high. This level also represents the most immediate liquidity zone and offers a favorable risk-reward ratio. Confirmation may come through bullish candlestick patterns or lower timeframe breakouts above minor internal highs.
The overall setup reflects smart money concepts, where price typically returns to a mitigation block before continuing in the direction of the dominant trend. As long as the 0.6415 valid low holds, bullish continuation remains the preferred scenario. A break below that level would invalidate the setup and shift bias bearish.
This analysis is ideal for intraday traders looking to capitalize on a high-probability reversal with defined entry and target levels.

AUD/USD Sentiment Sours (But There May Better Shorts)Asset managers increased their net-short exposure last week - and as these are 'real money' accounts, they are a group of traders worth listening to. But as always, timing as key, and there may be better setups for bears than AUD/USD over the near term. Today I pick out for AUD crosses to consider.
Matt Simpson, Market Analyst at City Index and Forex.com

AUDUSD Still on the Bullish Leg of its 3-year Channel Down.The AUDUSD pair has been trading within a Channel Down since the August 08 2022 High and is currently testing the 1W MA50 (blue trend-line) as a Resistance. This is a big Resistance cluster as it also made contact with the Pivot trend-line from the pattern's first Low.
However, all Lower Highs of the Channel Down have been priced above its 1W MA50, with three Tops forming on the 1W MA200 (orange trend-line). As a result, we expect a few more months of uptrend on this Bullish Leg until it approaches the 1W MA200. Our Target is 0.67000.
-------------------------------------------------------------------------------
** Please LIKE 👍, FOLLOW ✅, SHARE 🙌 and COMMENT ✍ if you enjoy this idea! Also share your ideas and charts in the comments section below! This is best way to keep it relevant, support us, keep the content here free and allow the idea to reach as many people as possible. **
-------------------------------------------------------------------------------
💸💸💸💸💸💸
👇 👇 👇 👇 👇 👇

Nasdaq 100 set for 25k?The Nasdaq 100 is in a technical bull market, having rebounded 20% from its cycle low. While the risk remains that this is simply a 'bear market bounce' that could sucker punch bulls, I believe bulls have got this and we could be headed for 25k.
Matt Simpson, Market Analyst at City Index and Forex.com

ASX looking ripe for the picking after C&H -Target 9,163Looks like the next international index that is ready to rally is the Australian 200.
It seems like the American presidency is having a domino effect which is resonating with down under including the following:
📉 Tariff Truce Sparks Global Optimism
A 90-day pause and significant reduction in U.S.-China tariffs have alleviated trade war fears, boosting investor confidence worldwide.
📈 Wall Street Surge Sets Positive Tone
Major U.S. indices, including the S&P 500 and Nasdaq, have rallied on trade deal hopes, providing a strong lead for the ASX.
Market Index
🛢️ Commodity Prices Climb with Trade Hopes
Anticipation of increased demand from China has driven up iron ore and oil prices, benefiting Australia's resource-heavy market.
💰 Australia Attracts Global Investors
With a stable economy and low exposure to U.S. tariffs, Australia is becoming a preferred destination for investors seeking alternatives to U.S. markets.
Reuters
And technically, we have the text book Cup and Handle showing upside to come.
Cup and Handle
Price> 20 and 200MA
Target 9,163
Disclosure: I am part of Trade Nation's Influencer program and receive a monthly fee for using their TradingView charts in my analysis.

AUDJPY - Bullish Double BottomHello Traders !
On Tuesday 6 May, The AUDJPY reached the support level (92.222 - 91.978).
The price formed a double bottom pattern.
At the moment, The Neckline is broken !
So, I expect a bullish move🚀
_______________
TARGET: 94.240🎯

AUDUSD: Channel Down aiming higher.AUDUSD is neutral on its 1D technical outlook (RSI = 53.946, MACD = 0.004, ADX = 53.336) trading between the 1D MA200 and 1D MA50. It is now on the middle (0.5 Fibonacci level) of the long term Channel Down and every bullish wave touched at least the 0.236 Fib. The trade is long, TP = 0.66200.
## If you like our free content follow our profile to get more daily ideas. ##
## Comments and likes are greatly appreciated. ##

EURAUD - Bearish Head and ShouldersHello Traders !
The EURAUD failed to create a new higher high!
The price formed a head and shoulders pattern.
At the moment, The neckline is broken !
So, I expect a bearish move📉
_______________
TARGET: 1.71900🎯

AUDCAD - BULLISH MOVEHello Traders !
The AUDCAD failed to create a new lower low !
The Lower high is broken (change of character).
So, I expect a bullish move🚀
________________
TARGET: 0.88480🎯

Market Analysis: AUD/USD Gains Pace, Bulls Are Back?Market Analysis: AUD/USD Gains Pace, Bulls Are Back?
AUD/USD started a decent increase above the 0.6150 and 0.6200 levels.
Important Takeaways for AUD USD Analysis Today
- The Aussie Dollar rebounded after forming a base above the 0.6000 level against the US Dollar.
- There is a connecting bullish trend line forming with support at 0.6260 on the hourly chart of AUD/USD at FXOpen.
AUD/USD Technical Analysis
On the hourly chart of AUD/USD at FXOpen, the pair started a fresh increase from the 0.5940 support. The Aussie Dollar was able to clear the 0.6065 resistance to move into a positive zone against the US Dollar.
There was a close above the 0.6200 resistance and the 50-hour simple moving average. Finally, the pair tested the 0.6315 zone. A high was formed near 0.6314 and the pair recently started a consolidation phase.
There was a move below the 0.6300 level. The pair remained above the 23.6% Fib retracement level of the upward move from the 0.5913 swing low to the 0.6314 high.
On the downside, initial support is near the 0.6260 level. There is also a connecting bullish trend line forming with support at 0.6260. The next major support is near the 0.6220 zone. If there is a downside break below the 0.6220 support, the pair could extend its decline toward the 0.6205 level.
Any more losses might signal a move toward 0.6065 and the 61.8% Fib retracement level of the upward move from the 0.5913 swing low to the 0.6314 high.
On the upside, the AUD/USD chart indicates that the pair is now facing resistance near 0.6315. The first major resistance might be 0.6340. An upside break above the 0.6340 resistance might send the pair further higher.
The next major resistance is near the 0.6385 level. Any more gains could clear the path for a move toward the 0.6450 resistance zone.
This article represents the opinion of the Companies operating under the FXOpen brand only. It is not to be construed as an offer, solicitation, or recommendation with respect to products and services provided by the Companies operating under the FXOpen brand, nor is it to be considered financial advice.

AUDCAD Excellent Channel Down bottom opportunity.The AUDCAD pair has been trading within a long-term Channel Down since the January 26 2023 High and the recent Trade War fueled sell-off took the price almost on its bottom (Lower Lows trend-line).
The 1D RSI got vastly oversold at 14.00 and a bottom is to be expected within the next 2 weeks. Still, this level is low enough to be considered a solid long-term buy opportunity already. The previous bottom rebound targeted initially the 0.5 Fibonacci retracement level, so our target is 0.88850 on the medium-term.
-------------------------------------------------------------------------------
** Please LIKE 👍, FOLLOW ✅, SHARE 🙌 and COMMENT ✍ if you enjoy this idea! Also share your ideas and charts in the comments section below! This is best way to keep it relevant, support us, keep the content here free and allow the idea to reach as many people as possible. **
-------------------------------------------------------------------------------
Disclosure: I am part of Trade Nation's Influencer program and receive a monthly fee for using their TradingView charts in my analysis.
💸💸💸💸💸💸
👇 👇 👇 👇 👇 👇

No Rate Hike, No Mercy – AUD/USD Selling in Style!Riding the wave of bearish structure, AUD/USD continues to follow the macro trend with laser precision. After the RBA held rates steady, we’re seeing the typical post-news dump play out—fueled by the market’s disappointment and reduced sentiment.
Technically, price respected the 4H Fair Value Gap (FVG) and showed strong displacement to the downside, confirming continuation.
Key Targets:
🔻 0.62311 – Minor liquidity
🔻 0.62185 – 1H Sell-side liquidity
🔻 0.61703 – Ultimate short-term sell-side target
Expecting the market to bleed lower unless major fundamentals flip the bias. Until then... the trend is your bestie.
DYOR 🧠📉
