AUDCHF: Time to Fall 🇦🇺🇨🇭
AUDCHF is trading in a bearish trend.
After the price set a new lower low, it started a correctional movement.
The pair reached a major falling trend line this week.
The market was stuck on that for a couple of days and formed a horizontal range on 4H.
Its support was broken yesterday.
It will most likely trigger a bearish trend continuation.
Goals will be 0.5935 / 0.588
❤️Please, support my work with like, thank you!❤️
Australiandollar

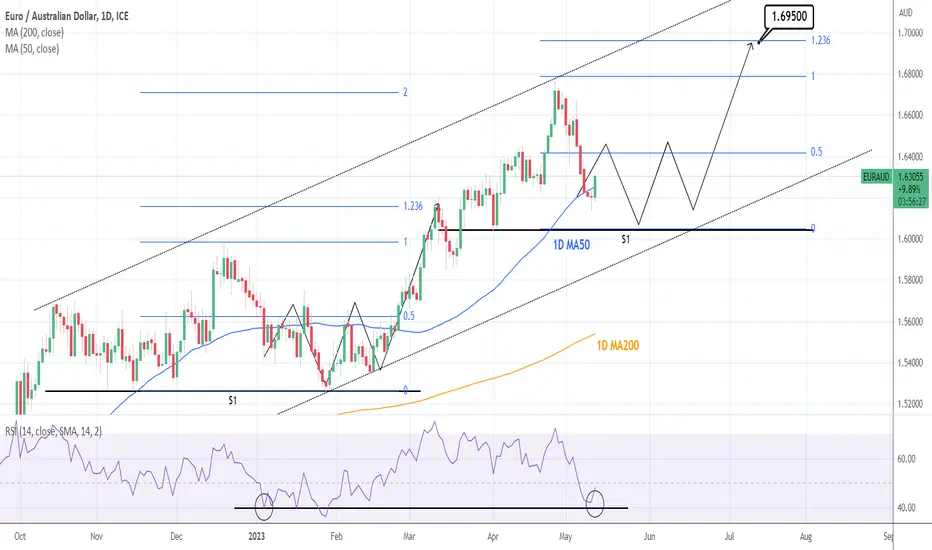
EURAUD: May take a month to establish a Support. Accumulation.The EURAUD pair is on a strong green 1D candle today, turning 1D technicals neutral again (RSI = 48.319, MACD = 0.001, ADX = 27.956) after the 1D RSI rebounded from a 42.000 three month low yesterday. It did so after crossing under the 1D MA50 for the first time in 2.5 months.
As long as S1 holds, we see a lengthy (even 1 month) support formation, inside a long term Channel Up, a formation similar to January/ February. Our long term target is the 1.236 Fibonacci (TP = 1.69500).
Prior idea:
## If you like our free content follow our profile to get more daily ideas. ##
## Comments and likes are greatly appreciated. ##
AUDCHF Short-term Buy SignalThe AUDCHF pair reached the bottom (Lower Lows trend-line) of the 2-year Channel Down pattern and rebounded, testing now the 1D MA50 (blue trend-line). Then that 1D MA50 test took place after the RSI on the 1W time-frame rebounded on its Support Zone, all three times the price hit the 1D MA200 (orange trend-line). This can happen a little quicker at 0.62000 or slower at 0.61500. Choose the appropriate target depending on the course of the price action.
-------------------------------------------------------------------------------
** Please LIKE 👍, FOLLOW ✅, SHARE 🙌 and COMMENT ✍ if you enjoy this idea! Also share your ideas and charts in the comments section below! **
-------------------------------------------------------------------------------
💸💸💸💸💸💸
👇 👇 👇 👇 👇 👇

EURAUD - Support Becomes Resistance📉Hello Traders👋🏻
On The Daily Time Frame The EURAUD Price Reached A Support Level (1.63148-1.62212) !
Currently, The Price Broke The Key Level (Support Level Becomes New Resistance Level)
If Price Stays Under The Key Zone,
EURAUD Can Continue The Bearish Move📉
-----------
TARGET: 1.60700🎯
___________
if you agreed with this IDEA, please leave a LIKE, SUBSCRIBE or COMMENT!

AUDUSD: Detailed Top-Down Analysis 🇦🇺🇺🇸
Multiple time frame analysis for AUDUSD.
Price action, key levels.
Potential scenarios & thoughts.
❤️Please, support my work with like, thank you!❤️

EURAUD Sell signal, short-term at leastThe EURAUD pair gave us last time (January 17) an excellent buy signal on the 1D MA200 (orange trend-line):
Right now the pair is testing its 1D MA50 (blue trend-line) following a Higher High rejection within the recent Channel Up. Technically that is a short-term sell signal and we will follow it, targeting the bottom of the Channel Up at 1.60500.
With the 1W RSI getting rejected after hitting the 70.00 overbought level, it is equally probable to see an extended selling, if the price closes a 1D candle below the Channel Up. In that case we will target the 1D MA200 around 1.58500. Until the break-out happens though, we will be on a tight SL buy at the bottom of the Channel Up, targeting Resistance 1 at 1.68000.
-------------------------------------------------------------------------------
** Please LIKE 👍, FOLLOW ✅, SHARE 🙌 and COMMENT ✍ if you enjoy this idea! Also share your ideas and charts in the comments section below! **
-------------------------------------------------------------------------------
💸💸💸💸💸💸
👇 👇 👇 👇 👇 👇

AUDNZD: Sell signal confirmed.The AUDNZD pair got rejected on the 1D MA50 turning the 1D technicals bearish (RSI = 42.793, MACD = -0.002, ADX = 30.864) for the first time in a month. The price got also rejected on the 1D MA200 and the LH trendline on April 21st, which started the current bearish leg. This may give a rise to a Channel Down. We are short, targeting the HL trendline (TP = 1.05300) and is the price closes under the S1, we expect a bearish extension to S2.
## If you like our free content follow our profile to get more daily ideas. ##
## Comments and likes are greatly appreciated. ##

GBPAUD Channel Up calling for a buy but short if it breaks lowerThe GBPAUD pair is trading within a Channel Up pattern since the February 02 Low. With the 1D MA50 (blue trend-line) supporting, it is attempting to fill the Gap form January 28 2022 and test that Resistance. As long as its holds we will be bullish targeting 1.92300. A closing below the 1D MA50 will be a sell signal, targeting the 1D MA200 (orange trend-line) on a projected contact target at 1.80000.
-------------------------------------------------------------------------------
** Please LIKE 👍, FOLLOW ✅, SHARE 🙌 and COMMENT ✍ if you enjoy this idea! Also share your ideas and charts in the comments section below! **
-------------------------------------------------------------------------------
💸💸💸💸💸💸
👇 👇 👇 👇 👇 👇

AUDCHF growth after completion of pullback(Short term)🚀!!!AUDCHF managed to break the downward trendline and 🔴resistance zone🔴.
Currently, it seems that AUDCHF has succeeded in completing a pullback; the sign of the completion of the pullback of the Hammer Candlestick pattern is near the resistance zone in the 15-minute and even one-hour time frames .
I expect AUDCHF to go up to at least the 🎯target🎯 I have marked on the chart.
🔅Australian Dollar/ Swiss Franc ( AUDCHF ) 1-hour time frame ⏰.
Do not forget to put Stop loss for your positions (For every position you want to open).
Please follow your strategy, this is just my idea, and I will be glad to see your ideas in this post.
Please do not forget the ✅' like '✅ button 🙏😊 & Share it with your friends; thanks, and Trade safe

AUDNZD Triangle close to breaking outThe AUDNZD pair has hit our previous target (see chart below) and is currently on a Triangle pattern:
The break-out of this pattern will dictate the next trend. Right now the price is below the 1D MA50 (blue trend-line) so currently we have to give a slight edge to the bearish break-out. In that case, our target will be 1.04700 (December 16 2022 Low). If the price closes above the Triangle (Lower Highs trend-line), we will buy the break-out, target 1.10000 (bottom of Pivot Zone) and then short from the top for the long-term.
P.S. The RSI's Rectangle can be of additional help for buying and selling.
-------------------------------------------------------------------------------
** Please LIKE 👍, FOLLOW ✅, SHARE 🙌 and COMMENT ✍ if you enjoy this idea! Also share your ideas and charts in the comments section below! **
-------------------------------------------------------------------------------
💸💸💸💸💸💸
👇 👇 👇 👇 👇 👇

AUDUSD Buy IdeaM15 CHoCH Happened.
Major Liquidity Taken by Market (Equal Lows.)
Wait for Buy Zone and CHoCH on M5.
Ride the Move.

Aud/usd sell setup weekly forecast Hello traders aus/usd is in rally up to get the liquidity then we probably will have a nice sell setup on our order block to get to those bisi fvg and thin liquidity area it is 1 to 2.5 RR very good setup it can take a little bit longer can be short term swing trade let me know what think

AUDCAD: Sell at the top of the Channel Down.The AUDCAD pair is on the 1D MA50 for the third successive day, which is also the top of the Channel Down pattern. The 1D technicals have turned neutral (RSI = 52.833, MACD = -0.001, ADX = 23.757), indicating that this is technically a firm sell entry.
We will use this opportunity to short and target the S3 (TP = 0.88650) as all the Higher Lows of the uptrend have been filled by this Channel Down. On the contrary, if the price crosses over the R1, we will go long and target the R2 (TP = 0.92400).
Prior idea:
## If you like our free content follow our profile to get more daily ideas. ##
## Comments and likes are greatly appreciated. ##

AUDCAD is growing again with the Double Bottom Pattern🚀By forming the Double Bottom pattern , we can confirm the end of wave C.
I expect AUDCAD to grow to at least the resistance line after breaking the neckline of the Double Bottom pattern. (I have specified AUDCAD growth 🎯 targets 🎯 in the chart for you).
💡Also, I shared with you the position with RR= 2.68 , but be sure to follow your strategy and not forget capital management.💡
🔅Australian Dollar/Canadian Dollar Analyze ( AUDCAD ), Daily time frame ⏰.
Do not forget to put Stop loss for your positions (For every position you want to open).
Please follow your strategy, this is just my idea, and I will gladly see your ideas in this post.
Please do not forget the ✅' like '✅ button 🙏😊 & Share it with your friends; thanks, and Trade safe.

AUDUSD, short squeeze (upside reversal) in order... coming soon.AUDUSD has been ranging horizontally at 61.8 FIB LEVEL on the daily data. This level has been a reliable major support so far.
Accumulation / net buying has transpired already. Expect some major shift on trend soon (upside).
Visual chart queues: The white stair line is about to touch the black "positive/plus sign" conveying a pending major trend shift to the upside.
Spotted at 0.660
TAYOR.
safeguard capital, always.

AUD/USD -3/5/2023-• Despite the hawkish surprise by the RBA yesterday, raising interest rates unexpectedly we are experiencing a fading momentum of the bullish reaction
• Reason behind this might be lack of conviction within the buyers
• US Dollar strength is back in the markets amid renewed fears amid banking woes and recession adding to that pricing of a continued Federal Reserve tightening policy
• Technically, picture doesn't seem really bright on the daily chart for the following reasons:
1- A potential head and shoulders pattern can be spotted and drawn on the chart
2 - 20 SMA is acting as a resistance with price unable to cross and close above it
3- The up trend support line which has been broken back in March has been re-tested from below several times with continuous rejection
4- Keep in mind that whether H&S pattern or any other, they have chance of failure and are subjective (other traders might see an inverse H&S on the same chart)
5- 0.6570 is the immediate strong support and longs can still be valid above that level with stops below it
6- After hitting a daily high of 0.67 following RBA surprise hike, we have seen some profit taking throughout the day and this might have happened due to the FED rate decision tomorrow and traders getting out of their positions while waiting for the outcome
Traders, if you like this idea please comment and like ✅
Here to answer all your questions,
Good luck

AUDCAD Testing the top of the Channel Down. Sell.The AUDCAD pair hit today the 1D MA50 (blue trend-line) for the first time in more than two months (since February 22). By doing so, it has approached both the Channel's top (Lower Highs trend-line) and Resistance 1 (0.912750) of the April 03 High.
With the 1W RSI still far from its Support/ Buy Zone, we treat today's rise as a sell opportunity and short towards the Channel's bottom (Lower Lows trend-line), targeting 0.8870 (November 21 2022 Low).
-------------------------------------------------------------------------------
** Please LIKE 👍, FOLLOW ✅, SHARE 🙌 and COMMENT ✍ if you enjoy this idea! Also share your ideas and charts in the comments section below! **
-------------------------------------------------------------------------------
💸💸💸💸💸💸
👇 👇 👇 👇 👇 👇

Corrective Movement for AUDUSDThe AUDUSD pair has reached a support level, with a divergence appearing on momentum indicators. This could lead to a corrective movement, with a retest of the channel it escaped from, the 100 and 200 moving averages for the 4-hour timeframe, and the Fibonacci level of 38.20% around 0.66630. The price is then expected to drop towards 0.6550.
Please share your thoughts in the comments and show your support by liking the idea. If you're interested in more ideas like this, please follow. Your support is appreciated!


AUDCAD - New Bearish Move 📉Hello Traders 💖
On The Daily Time Frame The AUDCAD Price Reached A Resistance Level 0.91064-0.90806 !
Currently, The Price Failed to Create new Higher High 📈
If Price Stays Under The Key Zone, AUDCAD Can Continue The Bearish Move 📉
-----------
TARGET: 0.89800🎯
___________
if you agreed with this IDEA, please leave a LIKE, SUBSCRIBE or COMMENT!

AUDJPY: Testing the 1D MA50, approximating the perfect shortAUDJPY continues to trade inside a Channel Down, testing today the 1D MA50 after a continuous 1 month counter trend rise. For the time being this is rise similar to the one that was completed on February 14th and made the latest Lower High on the Channe Down. The ideal short entry is between R1 and the 1D MA200. We set a long term target on AUDJPY on the bottom dotted trendline (TP = 85.000).
## If you like our free content follow our profile to get more daily ideas. ##
## Comments and likes are greatly appreciated. ##

AUDUSD will try to reverse to the upside after touching 78.6 FIBAUDUSD has been very volatile lately - to the point where it zigzag by 1000 pips.
This time it finally touched 78.6 FIB retracement, a very significant support this past few weeks.
0.660 is historically firm at this level, a major order block support. Expect buyers to come at this price range.
TAYOR 0.66
safeguard capital, always.

AUDJPY Sell opportunity on a Double Channel Down pattern.The AUDJPY pair is trading inside Channel Down pattern since the September 13 2022 High that is diverging some (dotted lines) to the 1D MA200 (orange trend-line). At the moment the price is ranged within the 1D MA50 (blue trend-line) and 1W MA100 (red trend-line).
Having previously broke below the 1W MA100, the current level is an ideal sell entry and with the 1D RSI showing similarities with with late 2022, we will target 83.450 as a Lower Low.
-------------------------------------------------------------------------------
** Please LIKE 👍, FOLLOW ✅, SHARE 🙌 and COMMENT ✍ if you enjoy this idea! Also share your ideas and charts in the comments section below! **
-------------------------------------------------------------------------------
💸💸💸💸💸💸
👇 👇 👇 👇 👇 👇
