AU200HELLO GUYS THIS MY IDEA 💡ABOUT AU200 is nice to see strong volume area....
Where is lot of contract accumulated..
I thing that the Seller from this area will be defend this SHORT position..
and when the price come back to this area, strong SELLER will be push down the market again..
DOWNTREND + Support from the past + Strong volume area is my mainly reason for this short trade..
IF you like my work please like share and follow thanks
TURTLE TRADER 🐢
Australianindex
XJO AUS200 retraced only 0.382, chops around median of pitchforkXJO acting as an inflation hedge, except when recession kicks in, which will kill all demand. XJO or AUS200 is outperforming US indices coz in a high inflationary environment, a country producing a lot of commodities tend to do better. Another example is Brazil with ticker symbol EWZ, which is also a good inflation hedge if dont want to use PFIX to capture rising rates. Gold right now is crashing with equities & not acting like an inflation hedge as it is supposed to do.
As you can see in the chart, there is a perfect pitchfork with XJO chopping around the dotted median. As shown in the past, the green pitchfork level should offer a strong support should XJO fail to hold the median of pitchfork. On the other hand, a bounce from the median may send XJO to the top of the pitchfork for a new high.
Also, XJO has made many measured moves…like the 3 DARVAS boxes or fractals down from its all-time-high. landing or stopping exactly at the Fibonacci 0.382. Next stop may be the 0.50 Fib & also along the green pitchfork level mentioned above.
Among some Australian commodity stocks doing well are IGO (lithium), BOE (uranium), & BHP (metals & potash)
Not trading advice
ETF:STW ASX200 key levels and trend lines analysis ASX:STW
sharing my view on the STW
Track Record – launched in August 2001, STW was the very first exchange-traded fund listed in Australia.
Core Index Exposure – a potential core Australian equity exposure for investors.
Diversification – low-cost exposure to over 90%1 of the Australian equity market capitalisation in a single transaction.
Capture Capital Growth and Income – capture potential stock growth opportunities, dividends and franking credits offered by 200 largest, and most liquid, publicly listed entities in the Australian equity market.
Rigorous Index Tracking – a rigorous investment approach that seeks to closely mirror the performance returns of the benchmark.
ASX: Australian stocks in need of a stronger pull back.The Australian stock market (AXJO) is currently rising after a strong pull back that took place in July. This rejection happened because the market reached its All Time Highs of October 2007. Despite the rather strong selling manner in which it was conducted, we believe that this sell sequence is not over yet and a stronger correction is needed.
The reason for this perspective is that the very same long term pattern on the 1W time-frame has been spotted back in 1994, when the ASX again pulled back after testing its (then) All Time High. The selling only stopped when the 1W MA200 came in for support.
We are expecting a similar price action and even though the correction on 1994 was more than -20% we expect this time just the 1W MA200 to be enough to support and initiate then next long term bullish leg. Use this pattern according to your own risk tolerance and strategy but this is our approach for the right time to re-enter this market.
** If you like our free content follow our profile (www.tradingview.com) to get more daily ideas. **
Comments and likes are greatly appreciated.
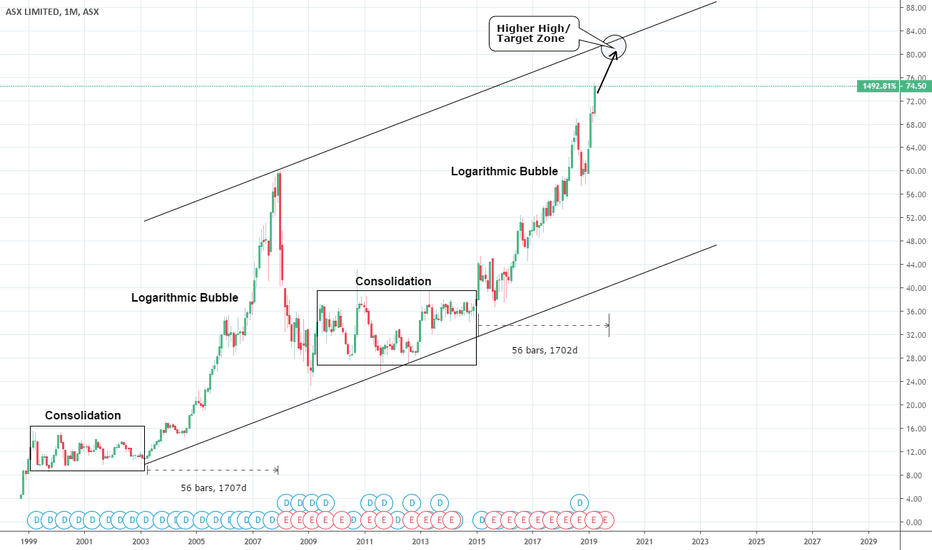
ASX: Australian stocks approaching a peak.The ASX Ltd is on a very strong bullish monthly streak having gained over +25% in 2019 alone. It appears to be trading inside a 20 year Channel Up that displays all phases of a Bubble (aggressive rise, blow-off, consolidation) from Higher Low to Higher.
Currently it is near the end of the bullish leg towards a new Higher High (peak) which is projected within 80.00 - 84.00 towards the end of 2019 (based on a 1702 day Bubble Duration). All charts are overbought (or close to) from 1D (RSI = 72.582) to 1W and 1M (RSI = 76.630 and 73.368 respectively) indicating that the peak of the bubble is indeed near and should be achieved on this final 2019 push.
Our strategy is to buy on every dip until this Target Zone. Then depending on circumstance and mostly global trade dynamics, we will most likely start building up a short base but updates will follow.
** If you like our free content follow our profile (www.tradingview.com) to get more daily ideas. **
Comments and likes are greatly appreciated.


