AUS200 UNDER ATTACK: TRADERS RAID THE TREND!🔥 Australia 200 HEIST: STEAL THE TREND LIKE A MARKET BANDIT! 🚨💰
Locked & loaded for the AUS200 (Australia200 Index) heist? This slick blueprint cracks the code to loot profits—blending killer technicals with macro intel. Ride the bullish wave, but dodge traps near the Overbought Zone. Bears lurk, so secure your bag before the reversal hits! 🐻💨
🎯 ENTRY: STRIKE LIKE A PRO THIEF
Long the breakout near 8430.00.
Set stealth alerts to catch moves in real-time. 🕶️🔔
🛡️ STOP LOSS: ESCAPE ALIVE
Hide stops under the last 2H swing low/wick—no reckless bets!
Adjust for your risk—survivors play smart. ⚡
💸 TAKE PROFIT: VANISH WITH THE LOOT
Main Target: 8650.00 (or bail early if momentum fades).
Scalpers: Trail stops & ghost out with quick wins. 🏃♂️💨
📡 WHY THIS HEIST WORKS
Australia 200’s on fire: Fundamentals + COT data + macro tides align.
Sentiment’s bullish, but stay sharp—links below for the full intel. 🔍🌐
⚠️ WARNING: NEWS = POLICE SIRENS
Avoid new trades during high-impact news. 📢
Lock profits with trailing stops if you’re already in. 🔐
🤝 JOIN THE TRADING MAFIA
Smash LIKE, drop a comment, & let’s dominate the AUS200 (Australia200)! �
Ready for the next big move? Stay tuned. 👀
Happy hunting, chart pirates! 🏴☠️📉
Australianstocks

Australia 200 Cash 15mts intraday trend analysis for April 04,Overall trend looks bearish for the day with a strong resistance at 7753. The Buy Signals is confirmed with SL at 7651. Any fall from resistance may take this index down to 7665 and 7622.
The Market Timing line is also bearish for the day.

NAB IDEA HELLO GUYS THIS MY IDEA 💡ABOUT NAB is nice to see strong volume area....
Where is lot of contract accumulated..
I thing that the buyers from this area will be defend this LONG position..
and when the price come back to this area, strong buyers will be push up the market again..
UP TREND + Resistance from the past + Strong volume area is my mainly reason for this long trade..
IF you like my work please like and follow thanks

ANZ IDEAHELLO GUYS THIS MY IDEA 💡ABOUT ANZAUD is nice to see strong volume area....
Where is lot of contract accumulated..
I thing that the buyers from this area will be defend this LONG position..
and when the price come back to this area, strong buyers will be push up the market again..
UP TREND + Resistance from the past + Strong volume area is my mainly reason for this long trade..
IF you like my work please like and follow thanks

IDENTIFIED LONG ENTRY AREA - RIO TINTO LIMITED - RIO - WEEKLYThis time we look at the RIO's price in the Australian Stock Exchange ASX.
The black horizontal line is potentially the strongest support ever.
Price has strongly failed in the past to go under it.
The curve is coming back around those prices which probably pictures a buying zone.
It might probably interesting to buy while in the square and exit when the price goes back again above the up trending black dotted line.
Wanna Share Your Thought About This Idea ?

ASX 200ASX 200: bearish divergence at the top, and rejected from resistance zone as well. Right now at its hourly support of .618 Fib. Breaking this level tomorrow morning will take the price to .786 region, and after that 6400 support.
at 15 mins TF, a series of LH, LLs have been created already.

ASX (XEJ) Energy Sector ViewHi All,
Found an interesting article for avid chart users on XEJ Australian energy sector on ASX: Australian Stock Exchange, which I believe we can watch out for in the coming day.
The article is on kalkinemedia
and its title is
WPL to BPT: 4 ASX stocks under the spotlight as Energy index reaches multi-year resistance.

ETF:STW ASX200 key levels and trend lines analysis ASX:STW
sharing my view on the STW
Track Record – launched in August 2001, STW was the very first exchange-traded fund listed in Australia.
Core Index Exposure – a potential core Australian equity exposure for investors.
Diversification – low-cost exposure to over 90%1 of the Australian equity market capitalisation in a single transaction.
Capture Capital Growth and Income – capture potential stock growth opportunities, dividends and franking credits offered by 200 largest, and most liquid, publicly listed entities in the Australian equity market.
Rigorous Index Tracking – a rigorous investment approach that seeks to closely mirror the performance returns of the benchmark.

Optician Imaging Limited LongAfter a potential accumulation phase we might see a trend reversal and therefore we might observe buying pressure.
Long Strategy would be advised.

XJO - Technicals are saying a bearish move could be on the wayThe XJO chart has a bearish rising wedge formation that is coming to a cross roads. Looks like a break to the downside is highly probable leading into the end of the 20/21 financial year.

IBX Possible future trend...ASX:IBX
Imagion Biosystems Ltd
Just wait for trendline break for taking a long...

AD8 - Get ready for it to breakout!!Key Technicals - Symmetrical triangle pattern suggesting there could be some nice upside in AD8 ( roughly 30%). Looking to enter a Breakout of triangle pattern. Trend to continue bullish if we break the high side.
Key Fundamentals - Plenty of growth as AD8'S products are becoming more of a necessity rather than a luxury.
asx.api.markitdigital.com


RRL is reaching to a critical zone...
Take a closer look at the highlighted area in which, four different lines are acting as a support...
REGIS RESOURCES LIMITED RRL(ASX)
ASX:RRL


COBALT ETF (ASX:JRV+ASX:COB+ASX:CLQ+ASX:CLA+ASX:AUZ+ASX:ARV) I've created a list of companies to represent the price of Cobalt Mining Stocks on the Australian Stock Exchange, similar to an ETF.
Cobalt appears to be in early stages of a market cycle with utility across high-growth technology/industrial sectors: electric vehicles (lithium-ion batteries), semiconductors, renewable energy, etc.
Please do your own research before making an investment decision, this is not financial or investment advice. Due diligence is important.

EML - Bullish Flag - High ProbabilityKey Technicals - Bull flag, buy on bullish candle breakout of flag.
Key Fundamentals - Expecting 50% revenue growth + Rotation of money into recovey stocks + Leading innovation in the payments space.
www.asx.com.au

PNV.ASX flag break for possible $2.80 test. Hello Fellow Trader!
PNV.ASX flag break for possible $2.80 test.
breaking out of flag with strong sell off into close. A hold above $2.50 would be a great opportunity to target $2.80.
PNV.ASX - Polynovo LTD is an Australian-based medical device company that designs, develops and manufactures dermal regeneration solutions using its patented NovoSorb Biodegradable polymer technology.
Key Points:
- Price holding above the 200 EMA
- Price holding above the 50 EMA
- RSI above 50 mid-point
- Flag broken of upside
Key Levels:
Support - $2.50, $2.38, 50 EMA, 200 EMA
Resistance – $2.60, $2.80
Entry Zone:
Optimal entry provides the greatest reward to risk ratio while supporting entry is a zone for reversal signals.
Optimal Entry – $2.51
Supporting Entry – $2.55
Candle Reversals for entry
- Bullish Hammer
- Bullish Engulfing
- Bullish Piercing
The Risk:
As traders, it is your job to mitigate the risk and only trade structures that provide high probability and great reward to risk ratios.
If you are not comfortable with defined exit levels, experiment with Moving Averages to help set solid exit rules to protect your capital.
IF: Price breaks below 2.38 – this would suggest the structure is not in our favour and would be wise to reduce exposure or close the trade until a solid signal gives us reasons to re-enter.
Reward / Reward Targets:
Optimal Entry $2.51 – Target 1 $2.80 = 2.2x Reward to Risk
Supporting Entry $2.55 – Target 1 $2.80 = 1.5Reward to Risk

Bullish Flag Pattern for ABP.ASX Targeting $3.50Hello Fellow Trader!
Price pierced through resistance ($2.87) with volume and cleared the range where it’s now coiling above under the 200 EMA. ABP.ASX has not touched the 200 EMA since the pre Covid drop.
ABP.ASX – Abacus Property Group is a diversified property group specialising in Australia’s core commercial sector including office, retail, and industrial properties, self-storage facilities and property development ventures.
Key Points:
- Price hugging the 200 EMA
- Price holding above the 50 EMA
- Drop in volume within the flag
- Increased volume spike during the impulse drive
- Pierced through multi – month range
- Targets using Fibonacci multiples of prior impulse
Key Levels:
Support - $2.87, $2.79, 50 EMA
Resistance – $3.00, $3.25, $3.50
Entry Zone:
Optimal entry provides the greatest reward to risk ratio while supporting entry is a zone for reversal signals.
Optimal Entry – $2.93
Supporting Entry – $3.01
Candle Reversals for entry
- Bullish Hammer
- Bullish Engulfing
- Bullish Piercing
The Risk:
As traders, it is your job to mitigate the risk and only trade structures that provide high probability and great reward to risk ratios.
If you are not comfortable with defined exit levels, experiment with Moving Averages to help set solid exit rules to protect your capital.
IF: Price breaks below $2.79 or below 50 EMA– this would suggest the structure is not in our favour and would be wise to reduce exposure or close the trade until a solid signal gives us reasons to re-enter.
Reward / Reward Targets:
Optimal Entry $2.93 – Target 1 $3.25 = 2.3x Reward to Risk
Optimal Entry $2.93 – Target 2 $3.49 = 4x Reward to Risk
Supporting Entry $3.01 – Target 1 $3.25 = 1.3x Reward to Risk
Supporting Entry $3.01 – Target 2 $3.50 = 2.5x Reward to Risk

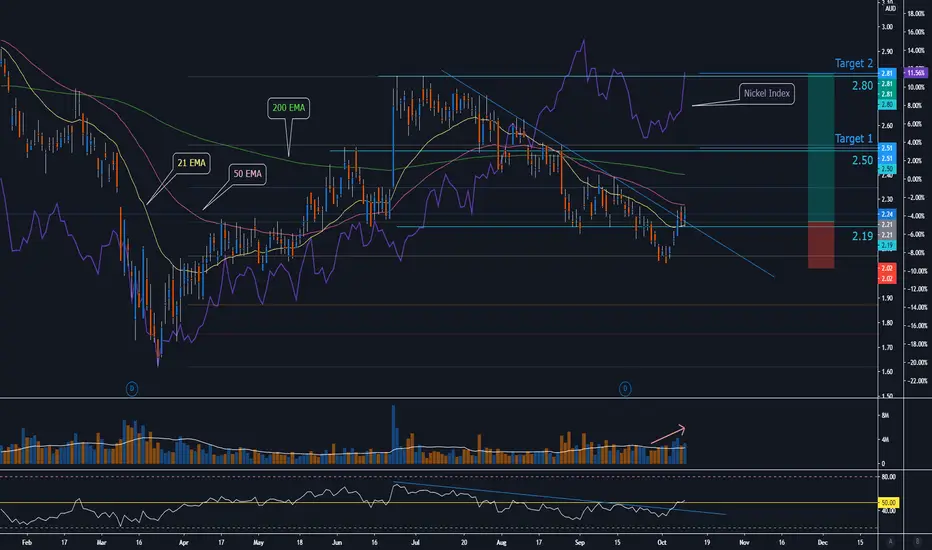
WSA.ASX Closes Above Trendline Target $2.50Hello Fellow Trader!
Nickel index quite strong last week increasing by 6% and potentially heading to test August highs. WSA has been supported at the 61.8% Fibonacci retracement closed above a multi-month trend line with volume.
Western Areas Limited is an Australian based nickel sulphide explorer and producer with its core 100% ownership asset in Forrestania Nickel Operation.
Key Points:
- Caution - Price holding below the 200 EMA
- Caution - Price holding below the 50 EMA
- Would like to see price hold above the trend line and protect $2.20
- Fibonacci 61.8% retracement support (March low – July high range)
- RSI breaking trend, 50 mid-point, and range simultaneously for momentum
- Price must hold $2.20 and signal with bullish candle or if 21 EMA crosses 50 EMA.
Key Levels:
Support - $2.10, $2.20
Resistance – 50 EMA, 200 EMA, $2.50, $2.80
Entry Zone:
Optimal entry provides the greatest reward to risk ratio while supporting entry is a zone for reversal signals.
Optimal Entry – $2.21
Supporting Entry – $2.25
Candle Reversals for entry
- Bullish Hammer
- Bullish Engulfing
- Bullish Piercing
The Risk:
As traders, it is your job to mitigate the risk and only trade structures that provide high probability and great reward to risk ratios.
If you are not comfortable with defined exit levels, experiment with Moving Averages to help set solid exit rules to protect your capital.
IF: Price breaks below $2.02 – this would suggest the structure is not in our favour and would be wise to reduce exposure or close the trade until a solid signal gives us reasons to re-enter.
Reward / Reward Targets:
Optimal Entry $2.21 – Target 1 $2.50 = 1.5x Reward to Risk
Optimal Entry $2.21 – Target 2 $2.80 = 3x Reward to Risk
Supporting Entry $2.25 – Target 1 $2.50 = 1.3x Reward to Risk
Supporting Entry $2.25 – Target 2 $2.80 = 2.5x Reward to Risk
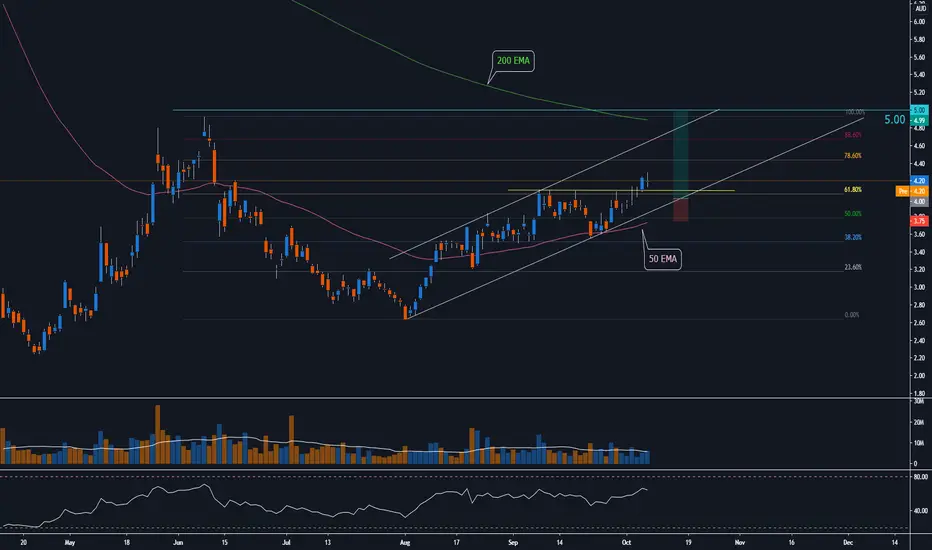
WEB.ASX Webjet breaking out of $4.00Hello Fellow Trader!
WEB.ASX sitting inside the channel awaiting any type of Covid related vaccine news for possible expansion.
Key levels broken at $4.00 with volume support now testing resistance at $4.20. A breakout could suggest $5.00 target at a minimum within the trend channel. WEB.ASX bottomed out in April but failed to break the low soon after. With Australia’s aviation industry dormant and earning season completing, price was not able to break the lower suggesting we could have witnessed the bottom.
Key Points:
- Price holding below the 200 EMA
- Price holding above the 50 EMA
- Fibonacci 61.8% broken and heading towards 78.6% (June high – August low range)
- Volume increasing supporting price appreciation
Key Levels:
Support - $4.00
Resistance – $4.20, $5.00
Entry Zone:
Optimal entry provides the greatest reward to risk ratio while supporting entry is a zone for reversal signals.
Optimal Entry – $4.00
Supporting Entry – $4.21
Candle Reversals for entry
- Bullish Hammer
- Bullish Engulfing
- Bullish Piercing
The Risk:
As traders, it is your job to mitigate the risk and only trade structures that provide high probability and great reward to risk ratios.
If you are not comfortable with defined exit levels, experiment with Moving Averages to help set solid exit rules to protect your capital.
IF: Price breaks below 3.74 level and violates 50 EMA – this would suggest the structure is not in our favour and would be wise to reduce exposure or close the trade until a solid signal gives us reasons to re-enter.
Reward / Reward Targets:
Optimal Entry $4.00 – Target 1 $5.00 = 4x Reward to Risk
Supporting Entry $4.21 – Target 1 $5.00 = 1.5x Reward to Risk