AVAX: Resistance BreakoutTrade setup : Bullish break above $35 key level signaled continuation of uptrend. However, price got very overbought (RSI ~ 90) and we’re likely to see it pause here on some profit taking. Nearest horizontal support zone is at $35 while the nearest Fibonacci Retracement levels (possible support) are $39 (23.60%) and $35 (38.20%). Hence, it appears that $35-$36 could be an attractive swing trade entry area in Uptrend, with upside potential to $50 thereafter.
Trend : Uptrend across all time horizons (Short- Medium- and Long-Term).
Momentum is Bullish but inflecting. MACD Line is above MACD Signal Line and RSI is above 55 but momentum may have peaked since MACD Histogram bars are declining, which suggests that momentum is weakening.
Support and Resistance : Nearest Support Zone is $35 (previous resistance), then $25. The nearest Resistance Zone is $50.
Avalanche

Avalanche ($AVAX) Surges 400% in Two MonthsAvalanche (AVAX) outperforms majority of large-caps, jumps to pre-LUNA-collapse levels.
After a marvelous 30% upsurge last week, AVAX replaced Dogecoin (DOGE) as the ninth largest cryptocurrency asset.
Its upsurge is driven by a combination of long-term and short-term catalysts as AVAX outperforms almost all large-cap altcoins.
Avalanche (AVAX) price rally expands The price of Avalanche (AVAX), the core native asset of the eponymous blockchain network, set a new local high at $44 on major spot exchanges today, Dec. 16, 2023. Last time AVAX was so expensive on May 8, 2022, before the ecosystem of Terra/Luna collapsed. As such, today marks an 83-week high for the AVAX price.
Last week, AVAX became the fastest-growing altcoin in the top 20 of the largest assets; in the top 30 of CoinMarketCap it was only surpassed by Internet Computer (ICP). In the last 24 hours, $4.88 million of AVAX positions, mostly shorts, were liquidated. The largest single liquidation was registered on OKX in an AVAX-USDT short and exceeded $128,000 in equivalent.
In the last two months, the total value locked (TVL) in Avalanche-based decentralized finance (DeFi) protocols almost doubled: It soared from $487 million to $949 million. Benqi, Trader Joe, Aave and GMX are the largest and fastest-growing DeFis in the ecosystem.

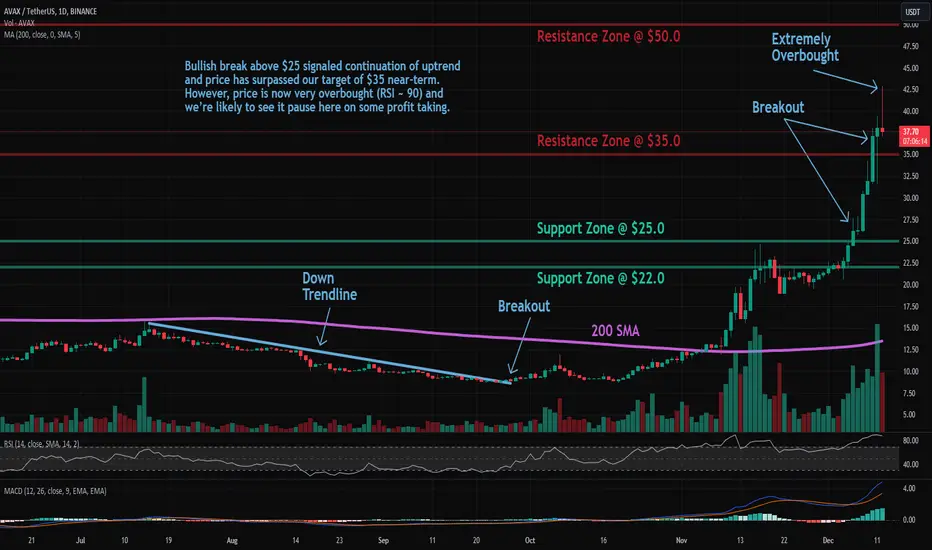
AVAX: Resistance BreakoutTrade setup : Bullish break above $35 signaled continuation of uptrend. However, price is now very overbought (RSI ~ 90) and we’re likely to see it pause here on some profit taking.
Trend : Uptrend across all time horizons (Short- Medium- and Long-Term).
Momentum is Bullish but extremely overbought. ( MACD Line is above MACD Signal Line). RSI is bullish (> 55) but extremely overbought (> 80) which could imply that price could briefly pause or pull back if it reaches Resistance.
Support and Resistance : Nearest Support Zone is $35 (previous resistance), then $25. The nearest Resistance Zone is $50.

Where is the destination of AVAX✅⁉️
🔴AVAX is poised to explode after a 130% surge in the last 3 months. Are you ready🔍👀
🔴Note: All white lines are PRZs, which are generated based on x.y.z.🎗️
🎗️AVAX to reach all-time high and surprise us?🌪️

AVAXUSD $55.00 is on the cards but then expect correction.Avalanche (AVAXUSD) hit all of our targets during November's run (see chart below) and even broke above the 1W MA100 (green trend-line) for the first time ever:
This resembles the incredible rally of January 2021, even though it has been executed during a different time period of the global Cycle. Nonetheless, one last spike to the 1.786 Fibonacci to make a February 08 2021 type High, is expected (target = $55.00) but then most likely the market will correct back to the 1W MA50 (blue trend-line). After that, our long-term target will be 105.00 (Resistance 1).
-------------------------------------------------------------------------------
** Please LIKE 👍, FOLLOW ✅, SHARE 🙌 and COMMENT ✍ if you enjoy this idea! Also share your ideas and charts in the comments section below! This is best way to keep it relevant, support us, keep the content here free and allow the idea to reach as many people as possible. **
-------------------------------------------------------------------------------
💸💸💸💸💸💸
👇 👇 👇 👇 👇 👇

AVAX: Resistance BreakoutAvalanche (AVAX) technical analysis:
Trade setup : Bullish break above $25 signaled continuation of uptrend and price has surpassed our target of $35 near-term. However, price is now very overbought (RSI ~ 90) and we’re likely to see it pause here on some profit taking.
Trend : Uptrend across all time horizons (Short- Medium- and Long-Term).
Momentum is Bullish but extremely overbought. ( MACD Line is above MACD Signal Line). RSI is bullish (> 55) but extremely overbought (> 80) which could imply that price could briefly pause or pull back if it reaches Resistance.
Support and Resistance : Nearest Support Zone is $25 (previous resistance), then $20. The nearest Resistance Zone is $35, which it broke, then $50.
AVAX/USDT Bracing for a Bullish Journey?👀 🚀Avax Today Analysis💎 Yello paradisers, spotlight on #AVAXUSDT as it unfolds a compelling narrative in the crypto trading landscape. Nestled within a demand zone and having recently executed a Market Structure Shift (MSS), it is showing strong signs of a potential bullish uptrend.
💎 Delving into #Avalanche's market trajectory reveals a pattern of strategic moves. AVAX has a history of meticulously following a descending trendline, only to break above it, ushering in upward movements.
💎 Presently, CRYPTOCAP:AVAX is poised to challenge a notable Bearish Order Block (OB), with its recent MSS trajectory adding credence to bullish prospects. Moreover, a deep dive into its performance shows it sustaining robust momentum above the EMA100, hinting that if this upward trend continues, targets at $31.13 and $41.34 supply levels may well be within reach.
💎 However, in the fluid crypto market, #AVAX traders should be prepared for varying outcomes. If the expected bullish breakout falters, a rebound strategy from the support level of $19.59 becomes essential.
💎 A drop below this support level would necessitate a strategy shift, indicating a need to reassess the bullish outlook and adapt trading strategies accordingly. 🌴💰

AVAXUSDT.P perfomance in 2023 till DecemberLooking back at 2023. Although the cryptocurrency market is in a difficult process. But there has been some pretty good growth recently. This is the backtest result from the beginning of the year until now of AVAX perp (AVAXUSDT). It can be automated.

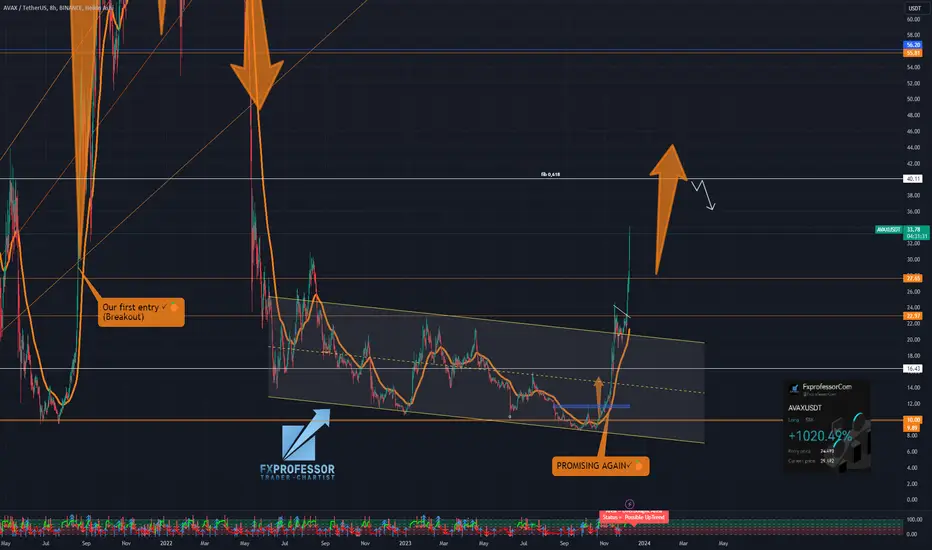
AVAX Avalanche: Scaling the Crypto TerrainHey Crypto Warriors! 👋 The FXProfessor here, exploring the exhilarating peaks of AVAX Avalanche. Let's dissect its current momentum and plot our course through this dynamic crypto landscape!
AVAX Avalanche's Market Dynamics:
📈 Experiencing Robust Growth: AVAX is not just climbing – it's soaring.
🎯 On the Radar: Aiming for pivotal targets as AVAX continues its ascent.
Key Support and Resistance Levels:
🛑 Solid Support: Watch out for crucial support levels that bolster confidence.
🧗♂️ Climbing to New Peaks: Breaking certain thresholds could signal a rally to new heights.
Strategic Outlook:
📊 Navigating through AVAX’s volatile landscape requires a keen eye and a steady hand.
⚡ Every step counts – whether it's a cautious hold or a strategic trade.
Long-Term Potential:
🌌 Exploring the potential for significant gains as AVAX challenges its limits.
🔭 Keeping a close watch on its trajectory towards ambitious long-term goals.
Trading Approach:
🌟 Patience and thorough analysis are crucial in harnessing AVAX's potential.
📝 Stay adaptive to its dynamic market movements.
FXProfessor's Insights:
🌐 AVAX isn't just another crypto; it's a bold player reshaping the digital asset space.
🔄 Regular updates to come as we track its thrilling journey.
Let's strategize wisely, stay ahead of the curve, and conquer the crypto mountains together!
One Love,
The FXProfessor 💙
ps. be careful not to FOMO.. We follow the market and chart levels
Celebrate the Avalanche's Unstoppable Rise!
It brings me immense pleasure to inform you that Avalanche continues to dominate the crypto space, with its price soaring higher than ever before, effortlessly surpassing the moving average. This remarkable achievement is a testament to the incredible potential and resilience of the Avalanche ecosystem.
Are you ready to ride the wave of success with Avalanche? If so, then consider this idea your invitation to join the Long Avalanche Movement today
Here's why I believe Avalanche is a golden opportunity worth exploring:
1. Unparalleled Performance: Avalanche has consistently outperformed market expectations, demonstrating its strength and stability amidst turbulent times. Its upward trajectory has been extraordinary, instilling confidence and excitement among traders worldwide.
2. Innovative Technology: Powered by Avalanche's groundbreaking consensus protocol, the platform offers lightning-fast transactions and low fees, making it an attractive choice for both institutional and retail investors. The ecosystem's commitment to innovation and scalability sets it apart from the competition.
3. Growing Adoption: Avalanche's popularity is on the rise, with an increasing number of projects and developers choosing to build on its robust infrastructure. The expanding ecosystem clearly shows the platform's widespread acceptance and potential for long-term growth.
So, how can you get involved and seize this opportunity? Here's your call to action:
1. Research and Educate Yourself: Dive into the world of Avalanche and familiarize yourself with its unique features, use cases, and potential. Understanding the technology and its implications will empower you to make informed investment decisions.
2. Stay Updated: Keep a close eye on Avalanche's latest news, project updates, and market trends. Follow reputable sources, join the community forums, and engage in discussions to gain valuable insights and stay ahead of the curve.
3. Take Action: When you feel confident and ready, consider adding Avalanche to your investment portfolio. Whether you're a seasoned trader or a beginner, there are various avenues available to participate in the Avalanche ecosystem, including spot trading, staking, and yield farming.
So, what are you waiting for? Join the Long Avalanche Movement.

Avax confirming the log channel breakout.You can see on this log chart that Avax has confirmed a breakout above the yellow channel. On its way to the breakout target it has los broken above an inv h&s neckline. This is a very asymmetrical inverse head and shoulders pattern as we can see the right shoulder is extremely tiny and the head appears to be Siamese. All the same if this inverse head and shoulders pattern also validate the breakout target for it is around $56. *not financial advice*

🏔️ Avalanche (AVAX) Insights 🚀Avalanche's price has skyrocketed recently, especially in the past few days. However, I anticipate that we might be approaching the end of this upward trend, and a significant correction for Avalanche could be imminent. Looking at the recent price action starting from the low in September, we've completed a Wave 1, followed by a Wave 2 correction, a swift Wave 3 with a quick Wave 4 beside it, and currently, an impulsive Wave 5 in progress.
While a short-term correction might be on the horizon, I still anticipate that even with a shorter correction, Wave 5 will likely conclude, possibly in early 2024. Subsequently, we might see a downturn towards the $25 to $16 range. The exact timing remains to be seen, but it seems like Avalanche's current high levels might not be sustained for much longer. 📉💨

AVAX/USDT In the crucial zone. Break out or rejected ??💎 AVAX has undeniably captured significant attention in the market. Currently positioned in a crucial area, it is encountering a robust supply zone. Today's closing candle, characterized by a strong green bullish engulfing pattern and a flawless bounce from the support area, hints at the possibility of an AVAX breakout in this region. Such a breakout would signal a bullish trend for AVAX, probability leading to a substantial upward movement toward our target area.
💎 However, if AVAX fails to overcome the formidable resistance of the strong supply area, facing a significant rejection, there's a likelihood of a retracement. AVAX may retreat, retesting the support area and potentially reaching the demand zone. It's noteworthy that AVAX is yet to undergo a retesting phase after breaking out of the descending channel. The demand area also coincides with the resistance trendline of the descending channel. If the support fails to hold, AVAX might experience a decline, testing the demand.
💎 The bad scenario is confirmed if, during the retesting phase at the demand area, AVAX fails to maintain its position and undergoes a breakdown. In such a case, AVAX would shift back to a bearish movement, potentially retracing to the key support area.

#AVAX/USDT 4h (ByBit) Ascending trendline breakdownAvalanche lost 50MA support and seems to be heading towards 200MA.
⚡️⚡️ #AVAX/USDT ⚡️⚡️
Exchanges: ByBit USDT
Signal Type: Regular (Short)
Leverage: Isolated (2.7X)
Amount: 4.9%
Current Price:
20.800
Entry Targets:
1) 21.465
Take-Profit Targets:
1) 15.010
Stop Targets:
1) 24.700
Published By: @Zblaba
CRYPTOCAP:AVAX BYBIT:AVAXUSDT.P #Avalanche avax.network
Risk/Reward= 1:2.0
Expected Profit= +81.2%
Possible Loss= -40.7%
Estimated Gaintime= 5-10 days

AVAX/USDT Bullish Prospects A Closer Look? 👀 🚀Avalanche💎 Paradisers, let's delve into the intriguing dynamics of AVAXUSDT. The recent shift from supply to demand zones indicates a strong likelihood of a bullish trend.
💎 Reflecting on its historical pattern, AVAXUSDT has consistently overcome its descending channel, leading to upward movements. Currently, with the transformation of supply into demand, there's a heightened chance of embarking on a bullish journey from this newfound demand level. The primary expectation is a breakthrough of the formidable resistance at 21.93, followed by a move to counteract the bearish Order Block (OB).
💎 On the flip side, if AVALANCHE struggles to maintain its upward momentum, a bullish strategy from the demand level of 15.19 may come into play. At this juncture, while some newcomers might resort to panic selling, the key is to wait for a definitive break below this demand level before making calculated trading decisions.

AVAX: Resistance BreakoutAvalanche (AVAX) technical analysis:
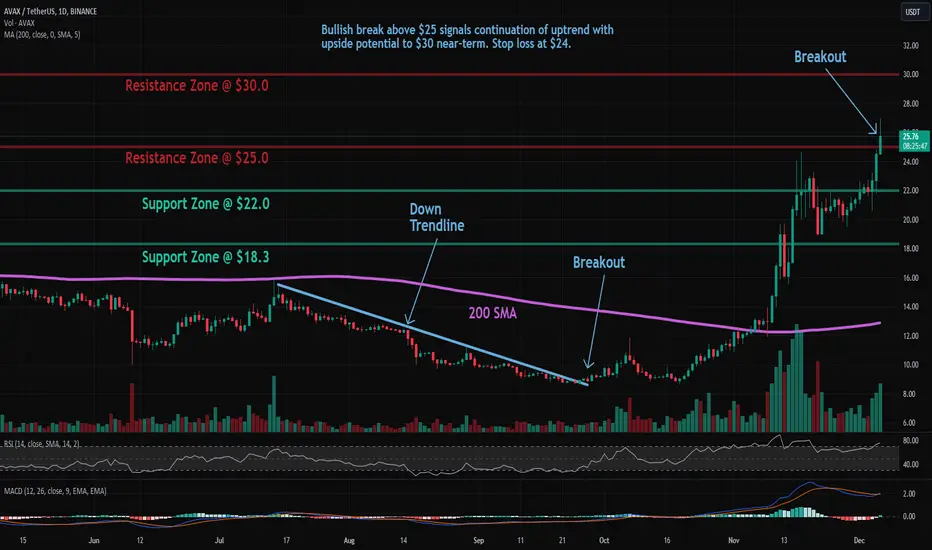
Trade setup : Bullish break above $25 signals continuation of uptrend with upside potential to $30 near-term. Stop loss at $24. Previously, price broke above 200-day moving average, which confirmed a bullish trend reversal to an Uptrend.
Trend : Uptrend across all time horizons (Short- Medium- and Long-Term).
Momentum is Bullish (MACD Line is above MACD Signal Line and RSI is above 55).
Support and Resistance : Nearest Support Zone is $22.0 (previous resistance), then $18.3. The nearest Resistance Zone is $25.0, which it broke, then $30.0.
Bull-channel (AVAX)❤️❤️Thanks for boosting 🚀 and supporting us!
📈we are in bull-channel so our position on buy and high channel level for next target.
📊 (Buy) : 22
🔴 Stop Loss : 21.11
🎯 Take Profit : 22.77 - 23.66 - 24.33
🔗 For more communication with us, send a message in TradingView.
👨🎓 Experience and Education: Our trading team has five years of experience in financial markets, especially cryptocurrencies.

AVAX: Pullback in UptrendAvalanche (AVAX) technical analysis:
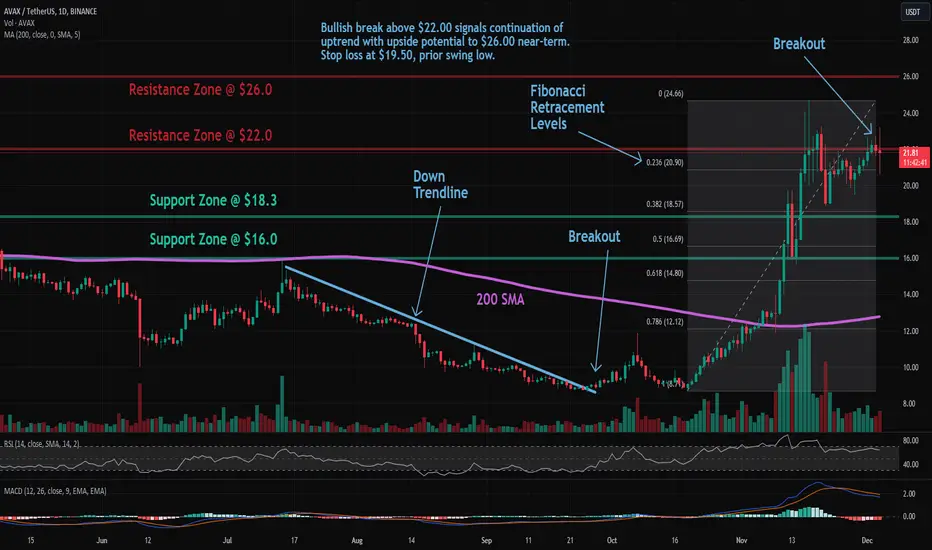
Trade setup : Bullish break above $22.00 signals continuation of uptrend with upside potential to $26.00 near-term. Stop loss at $19.50, prior swing low. Previously, price broke above 200-day moving average, which confirmed a bullish trend reversal to an Uptrend. Subsequently, price spiked as high as $24.70 but failed to hold that as traders began to take profits (selling pressure).
Trend : Uptrend across all time horizons (Short- Medium- and Long-Term).
Momentum is Mixed as MACD Line is below MACD Signal Line (Bearish) but RSI > 55 (Bullish). MACD Histogram bars are rising, which suggests that momentum could be nearing another upswing.
Support and Resistance : Nearest Support Zone is $18.3 (previous resistance), then $16.0. The nearest Resistance Zone is $22.0, then $26.0.
AVAX Bullish - Next move to 32ish if trend continuesAvax is looking real nice pull pennant formation
If this trend continues the next leg is likely to bring us near 32
Regardless this is a DCA for me!!
where my fellor accumulatoooorrs?

AVAX: Pullback in UptrendAvalanche (AVAX) technical analysis:
Trade setup : Price broke above 200-day moving average, which confirmed a bullish trend reversal to an Uptrend. Subsequently, price spiked as high as $24.70 but failed to hold that as traders began to take profits (selling pressure). Now we wait for price to either
1) break above $22.00 to signal continuation of uptrend, or
2) pull back near $18.30 support for a swing entry in Uptrend with upside potential back to $26.00. Nearest support levels are $18.30 and $16.00, which also lines up with Fibonacci Retracement levels of $18.60 (38.20%) and $16.70 (50%).
Trend : Uptrend across all time horizons (Short- Medium- and Long-Term).
Momentum is Mixed as MACD Line is below MACD Signal Line (Bearish) but RSI > 55 (Bullish).
Support and Resistance : Nearest Support Zone is $18.3 (previous resistance), then $16.0. The nearest Resistance Zone is $22.0, then $26.0.

AVAXUSDT Descending Channel Breakout!AVAXUSDT Technical Analysis Update
AVAXUSDT formed a descending channel pattern, and the price has already broken through the channel resistance with high volume. We can expect a good upward move in AVAX.
Buy zone : Below $16.90
Stop loss : $14.85
Always Keep Stop LOss
Thanks
Hexa

AVAX: Pullback in UptrendAvalanche (AVAX) technical analysis:
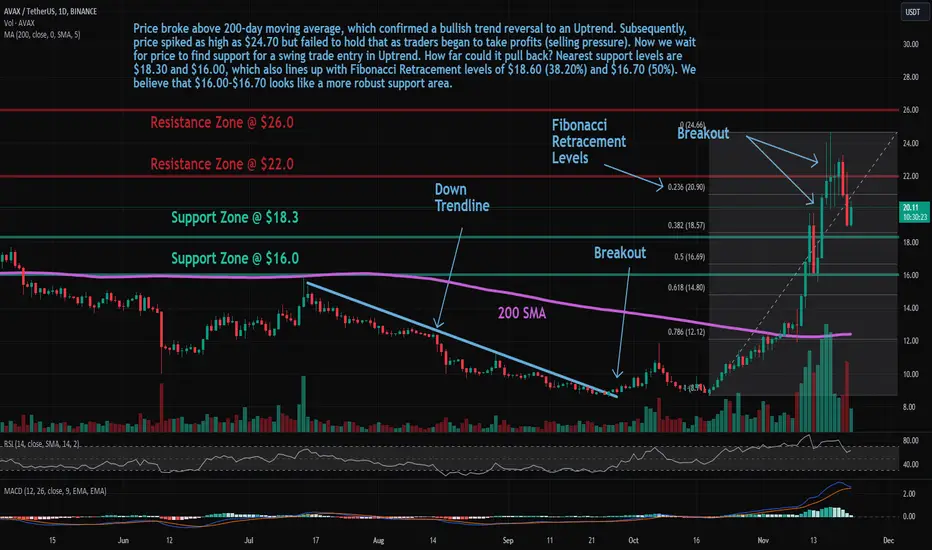
Trade setup : Price broke above 200-day moving average, which confirmed a bullish trend reversal to an Uptrend. Subsequently, price spiked as high as $24.70 but failed to hold that as traders began to take profits (selling pressure). Now we wait for price to find support for a swing trade entry in Uptrend. How far could it pull back? Nearest support levels are $18.30 and $16.00, which also lines up with Fibonacci Retracement levels of $18.60 (38.20%) and $16.70 (50%). We believe that $16.00-$16.70 looks like a more robust support area.
Trend : Uptrend across all time horizons (Short- Medium- and Long-Term).
Momentum is Bullish but inflecting. MACD Line is above MACD Signal Line and RSI is above 55 but momentum may have peaked since MACD Histogram bars are declining, which suggests that momentum is weakening.
Support and Resistance : Nearest Support Zone is $18.3 (previous resistance), then $16.0. The nearest Resistance Zone is $22.0, then $26.0.
Market Update - November 17th 2023
Bitcoin and ether dip early, but recoup some gains later in the week: Bitcoin and ether had a sudden drop on Tuesday as equity markets roared following a favorable inflation report. Both cryptos, however, retraced losses quickly. Ether was also boosted on Thursday as BlackRock filed its S-1 for a spot ether ETF with the SEC.
Solana’s upward trajectory continues as Cathie Wood touts the network: Solana gained ~8% this week as ARK Invest CEO Cathie Wood praised the network’s speed and cost-effectiveness in a CNBC interview. Solana has rallied ~150% over the past 30 days and is up more than ~325% over the past year.
Equity markets soar as inflation cooled in October: Lower-than-expected inflation data released on Tuesday fueled a strong rally across equities, with the S&P 500 and Nasdaq both gaining over 2% on the day. The favorable inflation data suggests we may be nearing the end of the Fed's interest rate hiking cycle, which has brought rates to a 22-year high.
Avalanche partners with JPMorgan and Apollo to bring blockchain to portfolio management: Avalanche announced a partnership with J.P. Morgan and Apollo Global Management during this week’s Singapore Fintech Festival to use blockchain technology in portfolio management. The initiative, overseen by the Singapore Monetary Authority’s (MAS) Project Guardian, plans to leverage blockchain smart contracts and tokenization to automate and simplify portfolio management.
📜 Topic of the Week: Private and Consortium Blockchains
🫱 Read more here
