AVAX: Resistance BreakoutAvalanche (AVAX) technical analysis:
Trade setup : Price broke above 200-day moving average and above $14.00 resistance, which confirmed a bullish trend reversal to an Uptrend. Subsequently, price spiked above $16.00, $18.30 and most recently $22.00 resistance levels. Price is now very overbought (RSI ~ 80!), hence, near-term, we’re likely to see it pause here on some profit taking, before resuming its Uptrend. Upside potential to $26 and $30 thereafter.
Trend : Uptrend across all time horizons (Short- Medium- and Long-Term).
Momentum is Bullish but extremely overbought. ( MACD Line is above MACD Signal Line). RSI is bullish (> 55) but extremely overbought (> 80) which could imply that price could briefly pause or pull back if it reaches Resistance.
Support and Resistance : Nearest Support Zone is $16.0 (previous resistance), then $14.0. The nearest Resistance Zone is $18.3, then $22.0 and $26.0.
Avalanche

Avalanche AVAX to $210 Within MonthsChart speaks for itself. The real fun for CRYPTOCAP:AVAX will start after it hits $210.
Observe On Balance Volume chart on bottom, and price fractal from last cycle's pump.
It is within reason we see this go to the 1.0 FIB extension which is over $2,000 / AVAX in one year's time.
If the T. Rowe Price ( Spruce Node ) for FOREX trading goes into production on Avalanche, this would be the white swan for $2k price rediscovery.
A fantastic HODL.
Not financial advice.

🔥AVAX HODLERS IN 90% LOSS! IS THIS A BIG CHANCE FOR WHALES❓The AVAX holders are in a huge loss since highs, so I think the updating the low at $9.3 will be the last stage of final capitulation where we will have the huge opportunity to add this altcoin in our portfolio.
Huge gree area should become the resistance, but it will become a huge support after the breakout of the price.
This is worth nothing for crypto market to turn $3.5M cap altcoin into $10M cap.
💥 is it worth to add to your watchlist? Yes, definitely.
Like♥️ and follow!

AVAX/US DOLLAR These are levels that I'll be keeping an eye on when dealing with BINANCE:AVAXUSD , and I'll revise as price action progresses.
I adapt to the change in money flow.
Fundamentals:
Amazon Web Services (AWS) has partnered with Ava Labs in a bid to accelerate the adoption of blockchain technology by enterprises, institutions, and governments.
The move has sent the linked Avalanche AVAXUSD token soaring higher in recent days, outperforming even Bitcoin amid a major bull run in the biggest cryptocurrency. *OLD ARTICLE*
.....
Monthly:
1. P.A. broke a key low
2. Demand (untouched) below broken key low
3. Key S/R being revisited for 1st time
4. Key S/R rest within untouched demand

#AVAX/BTC 1D (Binance) Falling wedge on supportAvalanche printed a morning star, seems likely to bounce back towards 100EMA resistance.
⚡️⚡️ #AVAX/BTC ⚡️⚡️
Exchanges: Binance
Signal Type: Regular (Long)
Amount: 13.4%
Current Price:
0.0003157
Entry Targets:
1) 0.0003101
Take-Profit Targets:
1) 0.0003796
Stop Targets:
1) 0.0002869
Published By: @Zblaba
CRYPTOCAP:AVAX BINANCE:AVAXBTC #Avalanche #L1 avax.network
Risk/Reward= 1:3
Expected Profit= +22.4%
Possible Loss= -7.5%
Estimated Gaintime= 3-7 weeks

AVAX/USDT Perfect Break from the resistance. Need retesting!!💎 AVAX has unquestionably attracted significant market attention. It executed a flawless breakout from the resistance area, characterized by substantial volume and a robust green bullish candle. However, on the daily timeframe, AVAX is yet to undergo the retesting phase at the support level, which previously served as the resistance area. There's a probability scenario where AVAX engages in a retesting phase at the support before resuming its upward trajectory toward the formidable supply area, representing our target zone.
💎 Yet, there's a possibility that AVAX might skip the support retesting phase at $15.70 and directly ascend to the potent supply area, encountering a formidable bearish rejection that triggers a downward movement towards the support level.
💎 In the event that AVAX eventually reaches the support level and undergoes a breakdown, there remains a chance for a reversal. A successful bounce from the demand area at $12.30 could pave the way for AVAX to reclaim the support level at $15.70.
💎 The unfavorable scenario unfolds if, during the retesting at the demand, AVAX struggles to sustain its position and breaches the demand area. In such a scenario, AVAX would revert to a bearish movement, potentially retracing to the key demand area.

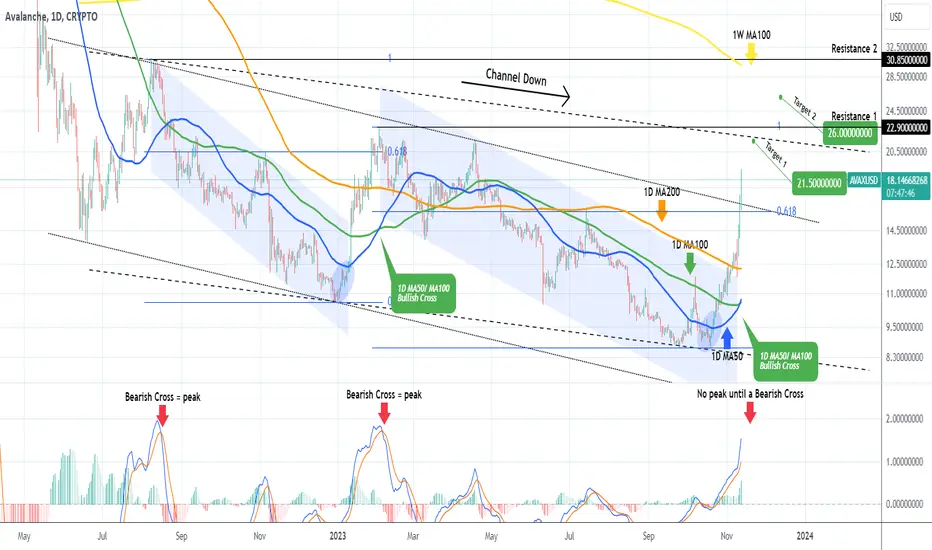
AVAXUSD Targets achieved. What's next?Avalanche (AVAXUSD) hit today our final (2nd) target of 15.5000 as we proposed on the bullish break-out signal we gave (see chart below) on October 04:
The question is, does this rally still have fuel in it or it will correct now? A reliable indicator in this case is the 1D MACD which, while the crypto has been inside the Channel Down pattern, it peaked both times just below 2.0000. This peak was confirmed only after a Bearish Cross. As a result, this rally still has room to go higher and the strongest Target (1) is the top of the top of the (dashed) final Channel Down that remains valid at 21.500. A break above Resistance 1 (22.9000) could also deliver a test of the 1W MA100 (yellow trend-line) at 26.000, but it is very doubtful to see a greater extension without a meaningful pull-back first.
-------------------------------------------------------------------------------
** Please LIKE 👍, FOLLOW ✅, SHARE 🙌 and COMMENT ✍ if you enjoy this idea! Also share your ideas and charts in the comments section below! This is best way to keep it relevant, support us, keep the content here free and allow the idea to reach as many people as possible. **
-------------------------------------------------------------------------------
💸💸💸💸💸💸
👇 👇 👇 👇 👇 👇
AVAX Avalanche Buy AreaLooking at the chart, in my opinion, the buy area for AVAX between $7.20 and $10.40 presents a great potential entry opportunity for long term investors.
This range provides a relatively wide margin for investors to consider entering a position in AVAX.
AVAX, the native token of the Avalanche blockchain platform, has shown promising growth and adoption in recent times.
The lower end of the buy area, around $7.20, could be seen as a more attractive entry point for those seeking a potentially lower risk position. On the other hand, the upper end of the range, around $10.40, may offer a higher potential reward for investors willing to take on more risk.
Looking forward to read your opinion about it!

AVAX Rockets to New Heights! Get Ready to Ride the Bullish Wave
I witnessed Avalanche (AVAX) make a stunning 15% pump, propelling it towards its next resistance level of 0.34. Brace yourself, my friend, because AVAX is about to take off like never before!
AVAX has been on a remarkable journey lately, defying expectations and gaining significant momentum. The recent 15% surge has brought it tantalizingly close to breaking through the 0.34 resistance level, marking a potential turning point for this incredible cryptocurrency. This is not just a random spike, but rather a clear indication of the bullish wave that is building up behind AVAX.
Now, you might be wondering, "How can I ride this wave and make the most of this opportunity?" Well, my friend, it's time to consider taking a long position on AVAX. By going long, you can potentially capitalize on its upward trajectory and reap the rewards of its anticipated surge. The market sentiment is overwhelmingly positive, and AVAX's technical indicators are aligning perfectly to support this exciting rally.
Here's your call-to-action: Don't miss out on this golden opportunity to maximize your gains! Seize the moment and consider opening a long position on AVAX today. Take advantage of the current bullish sentiment and position yourself for potential profits as AVAX confidently smashes through the 0.34 resistance level.
Remember, timing is crucial in the crypto market, and AVAX's journey is just getting started. By taking a long position now, you position yourself ahead of the curve, ready to ride the wave as AVAX surges to new heights.
So, my friend, buckle up and join the AVAX revolution! Let's ride this bullish wave together and make the most of this exciting opportunity. Your potential for profit awaits!
Should you have any questions or need assistance in executing your trade, feel free to reach out by commenting below. I'm here to help you navigate this thrilling journey and ensure you make the most informed decisions.
Wishing you an exhilarating and prosperous trading experience!

Avax long (25% potential) tradeSimple - Avax breaking weekly and have already done the retest
Enter between 11-11.4
I see a continuation here to 14.3 (25% profit).
I like to set stop loss at 9.99. But it's all about your trading style and risk management, don't copy trade!

AVAX/USDT Ready for Bull Momentum? 🚀AVAX Analysis Today💎Paradisers, set your sights on AVAXUSDT! Its current trajectory is both intriguing and promising, as it stands strong at a pivotal support point, hinting at a potential upward swing.
💎In recent days, Avalanche has been charting its course within a descending triangle. Breaking past the triangle's support, it's now on an upward trajectory.
💎The first resistance hurdle is set at the $9.36 benchmark, followed by a sterner test at $10. Given its stance in the demand zone, we're optimistic about its chances to tackle these resistance points.
💎Yet, it's essential to stay alert: if AVAX dips below its current support, a bearish downturn towards the marked support could be on the horizon.
💎Sharpen your trading decisions for AVAX with ParadiseFamilyVIP. Delve into our expert analyses on AVAX and other potential tokens, refining your crypto game plan.

Box section : 8.81-10.09Hello?
Hello traders!
If you "Follow" us, you can always get new information quickly.
Please also click “Boost”.
Have a good day.
-------------------------------------
(AVAXUSDT chart)
The key is whether the price can be maintained by rising above 13.4704.
Therefore, from a long-term perspective, 13.4704 or lower can be considered the bottom range.
(1W chart)
The key is whether it can receive support and rise around 9.76.
At this time, what is important is whether the price can be maintained by rising above the MS-Signal indicator.
(1D chart)
You are looking at the 1M chart and the 1W chart, but you may be asking, is there a need to see the entire chart on the 1D chart?
The reason to view the 1D chart as a full chart is to see how support and resistance points are marked.
You can check support and resistance points through the 1W chart and 1M chart, but since they only show approximate points, it may be burdensome to use them in your trading strategy.
The only support and resistance point formed across the entire chart is the 7.72 point on the current chart.
Therefore, other support and resistance points can be said to be support and resistance points that are still being formed.
Therefore, this means that the role of support and resistance may be weak.
Therefore, AVAX can also be seen as a coin (token) that is likely to show a large upward trend whenever a full-fledged upward trend begins.
No matter how likely it is that there will be a big uptrend at any time, if the trading volume does not increase accordingly, it may be meaningless and should not be given much meaning.
The recent move caused the HA-High indicator to drop and create a new one.
Accordingly, the HA-Low indicator and the HA-High indicator are showing close proximity.
Accordingly, if it shows support in the 8.92-9.83 range, it seems likely that it will turn into an upward trend.
If we select the box section with this in mind, it falls within the 8.81-10.09 section.
Therefore, when the StochRSI indicator leaves the oversold range, the key is whether it shows movement out of the 8.81-10.09 range.
-------------------------------------------------- -------------------------------------------
** All explanations are for reference only and do not guarantee profit or loss in investment.
** Trading volume is displayed as a candle body based on 10EMA.
How to display (in order from darkest to darkest)
More than 3 times the trading volume of 10EMA > 2.5 times > 2.0 times > 1.25 times > Trading volume below 10EMA
** Even if you know other people’s know-how, it takes a considerable amount of time to make it your own.
** This chart was created using my know-how.
---------------------------------

#avax #avalanche something like this? #avax is forming a bearish Shoulder Head Shoulder (SHS) pattern and i showed the probable retrace and bounce zone on the chart. If markets make sudden rally , the scenario will be invalidated.
NOT FINANCIAL ADVICE. Always trade with your own strategy, not mine and not anyone else' s.

AVAX/USDT Break the Key area, Bullish Momentum for Avax ???💎 Paradisers, AVAX has undeniably made waves with its stellar rally post breaking out of the descending channel and touching the supply zone.
💎 On its initial attempt, AVAX faced a setback from the supply zone, retracing to a robust support level. However, with resilience, AVAX surged again, turning the supply into a demand zone.
💎 Currently, AVAX is facing hurdles at the resistance zone, and there's a likelihood of it retracing to the demand zone for a retest before making another push towards the resistance. Should it conquer the resistance, the path to the Bearish OB zone seems clear.
💎 Conversely, if AVAX struggles to hold onto the demand zone and breaks below, it might set its sights on the strong, and possibly even the crucial, support zones.

Technical and Fundamental TailwindsAvalanche (AVAX) has been gaining traction in the crypto sphere, with its price showing a bullish trend recently. As of October 6, 2023, the price of AVAX is $10.61. The crypto asset has seen a remarkable price surge of 7% and 10.41% in the recent past, making it a top performer among major cryptocurrencies. Several analyses suggest that the upward momentum will likely continue, propelled by technical and fundamental factors.
On the technical front, AVAX is showing signs of consolidating in a flag formation, which is often seen as a bullish indicator. The bulls are making efforts to push the price above the upper boundary of this channel, which could lead to further upside. Moreover, recent trading activities have seen AVAX rebounding from the $8.6 support zone and challenging the resistance at $10, with the latter being a crucial level for the asset to sustain its bullish momentum. The market sentiment has been turning bullish, with the asset overcoming a notable resistance trendline and targeting levels beyond the $10 value area.
On the fundamental side, the launch of StarsArena, a crypto-based social media application, has been mentioned as a potential catalyst for AVAX's price movement, indicating a positive ecosystem development. Also, the broader market sentiment, often influenced by Bitcoin's performance, has been a supporting factor for AVAX's price trends.
Most Probable Scenario:
The most probable scenario for AVAX would be continuing the bullish trend, targeting new highs. The critical support and resistance levels to watch are $8.6 and $11.21, respectively. A successful breakout above the $11.21 resistance could propel AVAX to target higher levels, while a failure to maintain above the $8.6 support may pause the bullish narrative. However, the recent bullish momentum and encouraging ecosystem developments position AVAX favorably in the market, hinting at a promising outlook.

AVAX/USDT bullish move incoming? 👀 🚀 Avalanche Today Analysis
💎 Paradisers, Heads Up! An intriguing opportunity is unfolding with AVAXUSDT as it steadfastly holds a key support level and is aligning for a bullish ascent.
💎 EURONEXT:AVAX has encountered robust rejection at the daily support of 8.68 and is setting the stage for upward momentum, likely aiming to retest the daily resistance zone shortly.
💎 A few days ago, a notable shift occurred as demand turned to supply, causing Avalanche price to plummet significantly. Currently, the RSI is indicating a bullish divergence, signaling that Avalanche is potentially on the brink of a bullish trajectory.
💎 If you are planning to trade, remember to strategically place a stop loss at 1.75% to safeguard your position. Trade wisely and stay tuned for more insights.

AVAX.USDT (Long Term) Ladies and Gentelman, It's Ho3ein again. Thank you for your time 👋👋
It's a new day and I want to tell you all about the support zone on Avalanche.
I think it will be interesting. Because I wanna tell you where is the best zone to buy and Hold Avalanche for the long term. Please be patient 👌👌
Before that, Please don't forget to Like 👍 , share ✌️ with your friends, and also write your comments ✍️ below the post. It gives me more positive energy to continue publishing my analysis.
As you see, we have Three main support zones. I'm sure the first one around 7.2-7.5 USD will be lost soon.
We will talk about the second and third ones.
The Second support zone is around 4.6 – 5 USD and it's really strong. I expect the price drops to this zone to stop dropping and the price after touching this zone to move up.
I bet it's not the End of the correction. Because I expect the Second zone could NOT hold the price and it will break and the price will move to the 3rd support zone.
Let me say something frankly, I don’t believe that the 3rd support zone around 2.6-2.9 will be broken. It's really strong more than you think and big whales are waiting to buy Avalanche in this zone.
Please be patient. control your emotions 🙏🙏
Opportunities in the market flow smoothly like a river 🧞♀️🧞♀️
It was my duty to tell you all the things you need to know.
Please ask me all your questions below the post.
Wish you Health and Wealth
Sincerely Yours 🙏
Ho3ein.mnD

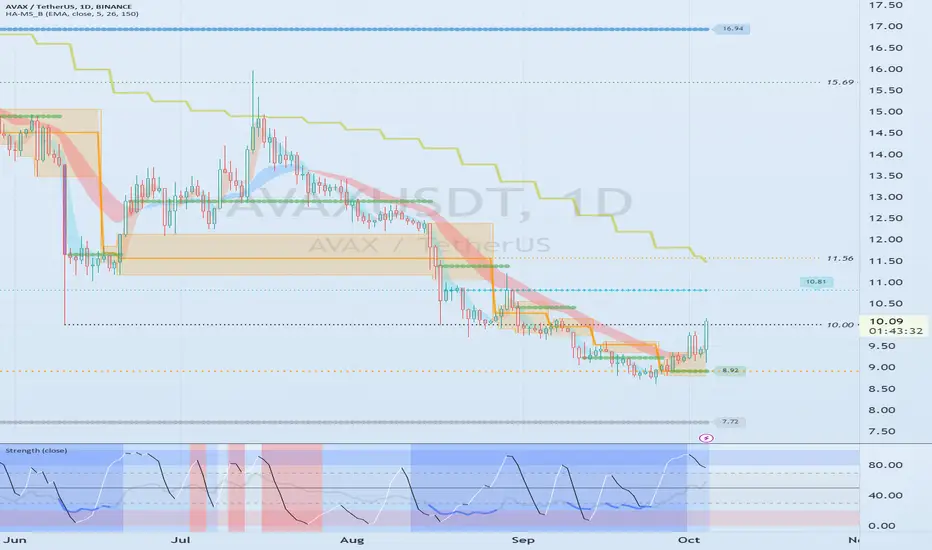
Need to check if it can rise above 10.81Hello?
Hello traders!
If you "Follow" us, you can always get new information quickly.
Please also click “Boost”.
Have a good day.
-------------------------------------
(AVAXUSDT chart)
The key is whether the price can be maintained above 9.76 and rise above 13.47.
(1D chart)
It is supported and rising in the 8.81-9.36 range.
The key is whether it can rise above 10.81.
If it receives support in the 10.81-11.56 range, it is expected to lead to an upward movement to around 15.69-16.94.
If this is not the case and it falls below 8.92 and shows resistance, caution is needed as it is expected to fall to around 7.72.
-------------------------------------------------- -------------------------------------------
** All explanations are for reference only and do not guarantee profit or loss in investment.
** Trading volume is displayed as a candle body based on 10EMA.
How to display (in order from darkest to darkest)
More than 3 times the trading volume of 10EMA > 2.5 times > 2.0 times > 1.25 times > Trading volume below 10EMA
** Even if you know other people’s know-how, it takes a considerable amount of time to make it your own.
** This chart was created using my know-how.
---------------------------------
AVAXUSD Ready for a bullish break-outAvalanche (AVAXUSD) has been trading within a Channel Down pattern for the past 6 months and is testing today the 1D MA50 (blue trend-line). The same kind of test after a 1D RSI Bullish Divergence was performed in AVAX's previous Channel Down on January 09 2023. Observe the perfect symmetry on the RSI levels of the two dates. When the price closed above the 1D MA50, it initiated a massive rise on the next candle that easily broke through the 1D MA100 (green trend-line), hit the 1D MA200 (orange trend-line) and peaked a little above the 0.618 Fibonacci retracement level.
As a result, we will buy the break-out and initially target the 1D MA100 at 11.000. If it breaks above the 1D MA200, we will buy that 2nd break-out and target the 0.616 Fib at 15.500.
-------------------------------------------------------------------------------
** Please LIKE 👍, FOLLOW ✅, SHARE 🙌 and COMMENT ✍ if you enjoy this idea! Also share your ideas and charts in the comments section below! **
-------------------------------------------------------------------------------
💸💸💸💸💸💸
👇 👇 👇 👇 👇 👇

Avalanche: Already done?! 🤔Avalanche has recently experienced a renewed rise, which has ended in the last few hours. We have to admit that the price has approached our magenta target zone (coordinates: $9.03 - $5.62), thus fulfilling the (minimum) technical requirement for this move; however, until the price convinces us of a final backed low of wave (2) in yellow with further clear rallies, we still have to assume that it will go a bit deeper into our zone. Ideally, we see the price approaching the lower violet trendline here, but of course, it can use the entire target zone to complete the reversal. In turn, traders can use the zone to enter long positions.

🔥 AVAX In Serious TroubleAVAX is one of the weakest bigger alts that's currently on the market. With AVAX losing the key purple support area, I'm anticipating further selling. With a weakening Bitcoin, I won't be surprised if AVAX will fall back all the way to the 2021 lows.
From a TA perspective, this yellow area would be a decent long-term entry area if you're waiting for a long-entry. However, there is a reason for AVAX to be so weak, so be watchful.

AVAXUSDT - Catch This Move! ✅Avalanche is currently in a simple ABC pattern. We have completed wave A and now in wave B that looks like an ABCDE pattern.
Looking to catch wave C once we finish subwave E of wave B.
Trade idea:
- Risk entry on break of orange trendline
- Safe entry on break of red trendline
- Stops below lows after we break either of the aforementioned trendlines
- Targets: 16.5, 21, taper
Goodluck and as always, trade safe!

🔥 AVAX Deep Oversold Bounce PlayAVAX has been on a massive losing streak for well over a year now. Even with BTC being relatively bullish in 2023, AVAX has made a new bear-market low last week.
Nevertheless, this token enjoys a lot of popularity across the internet. With AVAX trading in a historically very strong area of support and the 3-day RSI hitting oversold recently, I think it's time to scout for a potential reversal trade.
Stop just below the recent lows, target at 30$. More defensive traders might want to take (partial) profits around 20$.
