AVAX Long Set-UpI entered a long position here on #AVALANCHE. A previous major low was swept and the price seems to be holding this level. I placed a stop loss below the previous wick low.
#Bitcoin also has swept its HTF pivot low and is looking to move higher in the short term.
----------------------------------------------------------------------------------------------------------------------
Every day the charts provide new information. You have to adjust or get REKT.
Love it or hate it, hit that thumbs up and share your thoughts below!
Don't trade with what you're not willing to lose. Calculate Your Risk/Reward!
This is not financial advice. This is for educational purposes only.
Avalanche

AVAX/USDT Best time to buy AVAX for a Long-term ?? Hello Paradisers, here's a gem to monitor closely!
💎 AVAX is consistently revisiting a strong demand zone, marking its fifth attempt.
💎Typically, with repeated tests, demand areas tend to weaken.
💎This suggests AVAX might pierce through this strong demand zone, aiming for fresh daily demand. Once there, expect a significant bounce-back, potentially indicating a liquidity sweep.
💎Additionally, on August 26th, AVAX is set to unlock a whopping 9.54 million tokens. This could exert downward pressure on the price. Stay alert

AVAX Golden Zone & Trend Break!?1AVAX has retraced to the golden pocket Fibonacci zone and has held the level long enough to break through the downtrend. This in my opinion is bullish and if Bitcoin stays neutral or becomes bullish, AVAX should have a strong move up from this level.
Every day the charts provide new information. You have to adjust or get REKT.
Love it or hate it, hit that thumbs up and share your thoughts below!
Don't trade with what you're not willing to lose. Calculate Your Risk/Reward!
This is not financial advice. This is for educational purposes only.


Avalanche Oversold Oscillators On The 4 Hourly!Oversold on MACD, RSI, and Stochastic RSI on the 4 hourly time frames. All 3 major oscillators in trough zones. First targets $14.00. Could drop in the lower $12 region though. Anything below $14 is a nice buy for Avalanche. Much peace, love, health, and wealth!

AVAX price prepares for an upward impulse, as far as it can go?Now the AVAXUSDT price is in consolidation under a strong mirror level. Buyers are likely gaining the strength to up break out. Looking at the chart on a large timeframe, we can say that this is a difficult task.
So, at the moment, we are making notes for ourselves on a rather modest potential growth in the price of Avalanche token (by the standards of the crypto market)
The first target is $13.90 +8%.
The second target is $14.80 + 15%.
In the price range of $13.90-14.80, sales of those who bought AVAX long a few months earlier, but the growth did not work out, and the deposit was in drawdown, may increase. Usually, in such situations, the human brain thinks: "I can at least sell my coins at "break-even" and it will be good.
If the Avalanche project is interesting to you, write about it in the comments, and then we will try to update our thoughts on possible price movements of AVAXUSD more often.
_____________________
Did you like our analysis? Leave a comment, like, and follow to get more

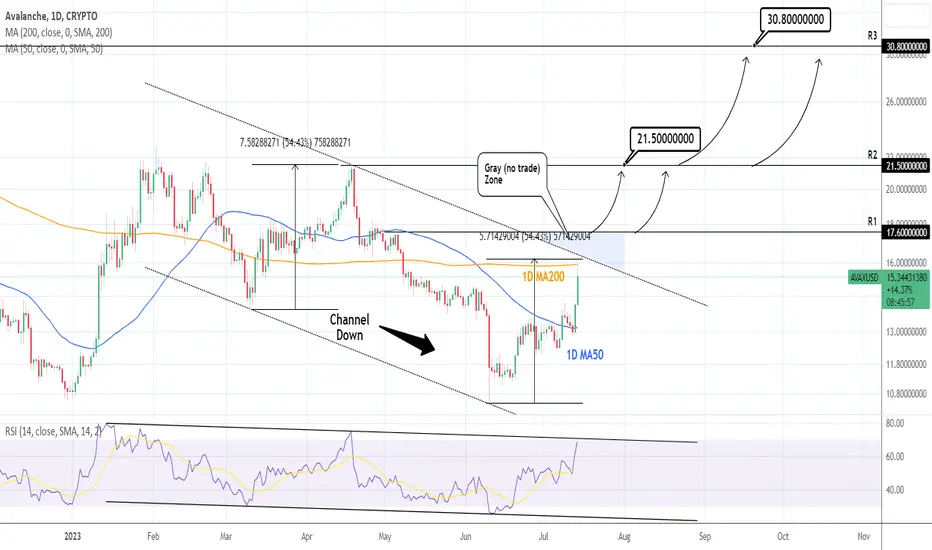
AVAXUSD: testing the 1D MA200 and top of 6 month Channel Down.AVAXUSD hit today the 1D MA200 for the first time since May 8th and almost reached the top of the Channel Down pattern. With the 1D timeframe turning bullish (RSI = 67.628, MACD = 0.250, ADX = 21.860) but the RSI also at the top of its own Channel Down, we want to get a confirmation of a breakout before buying and that will be above the R1 (17.6000), otherwise we will wait for a 1D MA50 retest. Either way, our medium term target is the R2 (TP1 = 21.5000) and long term the R3 (TP2 = 30.8000).
## If you like our free content follow our profile to get more daily ideas. ##
## Comments and likes are greatly appreciated. ##
AVAXUSD Crossed over the MA50 (1d). Buy signal.AVAXUSD is giving a bullish breakout signal today as it crossed over the MA50 (1d) for the first time since April 30th.
Even though there are two Resistance levels present above, the similarities with November-December 2022 imply that an aggressive rally past those is likely.
Trading Plan:
1. Buy on the current market price.
Targets:
1. 19.1500 (Fibonacci 0.786).
2. 21.5000 (Resistance 3).
Tips:
1. The RSI (1d) was oversold almost 1 month ago and has rebounding since. Avalanche typically peaks way above its overbought zone.
Please like, follow and comment!!

The 12.40-17.15 section is the buy sectionHello?
Traders, welcome.
If you "Follow", you can always get new information quickly.
Please also click "Boost".
Have a good day.
-------------------------------------
(AVAXUSDT chart)
Looking at the 1M chart,
A rise above 17.70 is expected to sustain the price before a full-fledged uptrend begins.
Looking at the 1W chart,
Currently, it is located in the section formed by the HA-Low indicator on the 1W chart.
Therefore, the key is whether it can rise with support in the current section.
However, since the HA-High indicator on the 1W chart is located nearby, it is not easy to actually buy.
The reason is that the resistance zones are so close together.
If the HA-Low and HA-High indicators are close together, you can see that they are converging as you can see by looking at the Bollinger bands.
Therefore, in this case, it is necessary to check whether it is supported or resisted in the section consisting of the HA-Low and HA-High indicators, and it corresponds to the buying section.
An upward breakout of the 19.73-23.96 zone is expected to release the converged forces.
To put the above 1M chart description and 1W chart description together,
If support is found at 17.70 on the 1W chart's HA-High indicator, it can be said that the uptrend is expected to begin.
Looking at the 1D chart,
The support and resistance points of the 1M, 1W, and 1D charts are combined in order of importance.
Therefore, many lines are drawn.
The interval of the HA-Low indicator on the 1W chart is the range of 12.40-13.83.
Therefore, if the price rises from support in this zone, it is more likely to break out of the downtrend line and continue the uptrend.
Accordingly, the key is whether the price maintains the price by rising above 13.83 based on the volatility period around July 15th.
If this is not the case and it declines, you should check for support near the HA-Low indicator on the 1D chart. (11.56-11.80)
The 14.99-17.15 section consists of the HA-High indicator on the 1W chart.
Therefore, it is expected that the price will turn into an uptrend only when it breaks above this section.
As I mentioned earlier, it is expected that a full-fledged uptrend will begin when the upward break of the 17.15-17.70 section and the 19.16-19.73 section.
-------------------------------------------------- -------------------------------------------
** All descriptions are for reference only and do not guarantee profit or loss in investment.
** Even if you know other people's know-how, it takes a considerable period of time to make it your own.
** This is a chart created with my know-how.
---------------------------------

AVAX Avalanche Double BottomAVAX (Avalanche) has shown a promising chart pattern with the formation of a double bottom, indicating a potential bullish reversal. This pattern suggests that the selling pressure has been absorbed, and a shift towards upward momentum may be on the horizon.
With the double bottom formation in place, AVAX has the potential to rally, and the first price target of $17 seems achievable. As the market sentiment improves and buying pressure increases, AVAX could experience a notable price appreciation.
Looking forward to read your opinion about it!

AVAX on THIN ICEBankrupt exchange Voyager Digital to shut shop after failed deals, details inside
According to Voyager Digital’s lawyers, the crypto lender will self-liquidate its assets after failing to reach an agreement on a sale to either FTX US or Binance.US.
The announcement, shared in a court filing on 5 May, comes just ten days after Binance.US abruptly backed out of a $1 billion deal to buy Voyager Digital’s assets when the US government intervened to prohibit part of it.
Prior to the agreement with Binance.US, the crypto lender made a similar offer to FTX. When FTX went bankrupt alongside Voyager in November, the first contract was cancelled.
Voyager stated in a filing that a number of digital assets on the platform that cannot be removed will be liquidated and returned to its users. These assets include major cryptocurrencies such as Algorand , Celo and Avalanche .
Avalanche’s latest collaboration with Chinese company Alibaba could change the game for AVAX in the cryptocurrency market. At press time, the excitement of the partnership was reflected on the AVAX charts.
Avalanche managed to secure a major partnership that could make it a stronger contender in the metaverse.
AVAX sees low demand despite the hype around a new partnership and supports retest.
Avalanche could be about to spice things up in the metaverse thanks to a major development that might be a game-changer. The development in question is a partnership with Chinese tech giant Alibaba.
According to Avalanche’s official announcement, the two secured a partnership through which Avalanche will be the conduit for Alibaba’s metaverse pursuits.
The partnership will focus on Alibaba’s Cloudverse, the cloud computing segment of the Chinese company which already has millions of customers. Avalanche will provide the decentralized technology to support this metaverse endeavor.
Today, @alibaba_cloud announced that they are entering the metaverse--on Avalanche!
With Cloudverse, Alibaba Cloud's millions of clients can easily deploy custom metaverses and unlock new dimensions for consumers.
#Avalanche will provide all blockchain elements for Cloudverse
Today, @alibaba_cloud announced that they are entering the metaverse--on Avalanche!
With Cloudverse, Alibaba Cloud's millions of clients can easily deploy custom metaverses and unlock new dimensions for consumers.
#Avalanche will provide all blockchain elements for Cloudverse
One of the ways to tell if the excitement has been converted into strong demand is to evaluate on-chain volumes. AVAX on-chain volume experienced a slight upside in the last 24 hours, although likely not strong enough to support enough bullish excitement.
Despite the lack of strong demand within the first 24 hours after the announcement, there was one key factor that may still support a strong bounce. AVAX’s price action had been trading within a tight range after finding support near the $16.50 price range. More importantly, the price was recently pushed into an ascending support line.
The same support level may act as a bounce-off zone if AVAX can secure enough bullish demand in the next few days. Its MFI already pivoted after previously registering outflows. Weak bullish demand or a surge in sell pressure may also manifest in the market sentiment shifts in favor of the bears.

Avalanche to tumble southward as the downtrend persistsThe daily and 4-hour price charts of Avalanche showed the bears were highly likely to drive prices lower, especially after the move below $13.88 on 5 June.
The higher timeframe charts showed that the mid-April rally failed to break key highs.
This was followed by a downtrend in May, but the $13.8 area posed some opposition to the sellers.
Avalanche had a bearish bias on the price charts. It is the fifth largest blockchain in terms of TVL but its DeFi activity stagnated in recent months. In other news, SushiSwap announced the launch of their v3 suite of products on Avalanche.
The price action presented short sellers with an opportunity. The structure was bearish, but the volatility has been high over the past 48 hours despite seller dominance. If the prices fall beneath $13.5, it would represent a continuation of the downtrend.
The market structure was bearish on the daily timeframe, and a downtrend was in progress. The 4-hour chart also showed a downtrend in progress. In May, the price formed a series of lower highs and lower lows.
The $13.88 level served as support, but AVAX still formed a low at $13.71 on 25 May. On 5 June, the price fell to $13.48, showing that bears remained dominant. Despite the bounce to $14.6 on 7 June, the market structure remained bearish.
Monday’s move was used to plot a set of Fibonacci retracement levels (pale yellow). It showed the 78.6% retracement level at $14.62, which explained the inability of the bulls to drive prices higher. Having established the bearish character of the market, a short trade can be entered upon a retest of the 50% retracement level at $14.21.
The 23.6% and 61.8% Fibonacci extension levels at $13.14 and $12.58 can be used to book profits. A move by AVAX above $14.93 would invalidate this idea as it represents a key short-term lower high.
It has been noted that the prices bounced to the $14.62 level on Wednesday. Despite that, the spot CVD continued to decline. Over the past 24 hours, the metric was flat, this showed buyers were in the minority and selling pressure was overwhelming.
The Open Interest picked up a little, amounting to close to $10 million. However, when AVAX faced rejection at $14.6, the open interest dropped further. This development hinted at discouraged bulls. Overall, the bearish sentiment was prevalent both on the low and high timeframes.

AVAX shortAVAX bounced off the upper boundary of descending channel. Bearish movement to support level at 13.5 is possible.

AVAX ROADMAPIf price can stay above 14$ than next step will be 16$ around.
If price can not stay above 14$ than we can see 11$-12$ levels.
Take your risk, make some profit !

AVAX I'm Lovin' ItHello friends,
we were quite bullish during the week, but when I look at the weekly, the humor passes me by and I think that this clown will come and screw it all up,
so hang on and if AVAX dips under 9, I told you so =D I' m Lovin' It ....
I hope I'm wrong

AVAX looks INTERESTING!KUCOIN:AVAXUSDT
AVAX is approaching an interesting level for a possible long providing a potential of about 40% upside gains.
However, since Bitcoin is sitting in a huge Head & Shoulders pattern, we must let our edge develop on lower time frames 4h to
look at entry triggers.
Should the Head & Shoulders activate, potential downside target to possible pullback zone is an idea.
Future markets open in about 3h 20m
Always having Plan A and Plan B scenarios so we can react once the markets provide an opportunity to execute our edge.
If you liked this idea or if you have your own opinion about it, write in the comments.
The information and publications are not meant to be, and do not constitute, financial, investment, trading, or other types of advice or recommendations.

AVAX, finally long?It finally looks like a breakout and retested, so we'll see, there's no place for failure, if there is fail then stop loss

Avalanche AVAX to 19.99$ ?👑 #AVAX/USDT BUY 👑
Entry:
14.60✅
Targets:
1️⃣15.89🎯
2️⃣16.96🎯
3️⃣17.84🎯
4️⃣18.73🎯
5️⃣19.99🎯

AVAX BULLISH IDEA (DOUBLE BOTTOM)Potential Bullish Entry Dow Theory In Place -
Higher High and Higher Low Expected in Place
Formation of double bottom coupled with bullish divergence (Bullish reversal pattern)
Entry, SL & TP Levels are defined.

Avalanche: Gardener 🌷🌹🌼🌻The weather is getting better and the ones who can prepare their garden for the incipient new season of barbecuing, sunbathing, harvesting or just savoring nature. In its green garden between $16.67 and $11.77, Avalanche still has got some work to be done as well and should advance a bit deeper to finish wave ii in orange. Ideally, our crypto gardener should turn upwards near the 100.00%-retracement at $13.64, heading for the resistance at $21.81. To develop wave iii in orange, Avalanche should then climb above this mark, which should provide the altcoin with further upwards momentum.

🔥🚀Avalanche (AVAX) Poised for Growth: Key Levels & Targets🔥Hi, friends! Avalanche is consolidating between 2 massive value areas. This is not good for volatility, but yesterday's shakeout shows that growth is much possible scenario. Why?
The sl of the long traders were triggered which gives the whales more liquidity and AVAX more chances to grow.
📊 TRADING PLAN FOR AVAX:
🔥 exit out of $ 17-17.8 value area
🔥 huge buy orders on DOM and Footprint
🔥 bullish BTC is a must-have for altcoins growth
✅ THE MAIN TARGETS FOR AVAX:
1. $ 19.5-20.2 - the value area
2. $ 22.2 - the key level and local high
3. $ 25 - the key level and even number
💻Friends, press the "boost"🚀 button, write comments and share with your friends - it will be the best THANK YOU.
P.S. Personally, I open an entry if the price shows it according to my strategy.
Always do your analysis before making a trade.

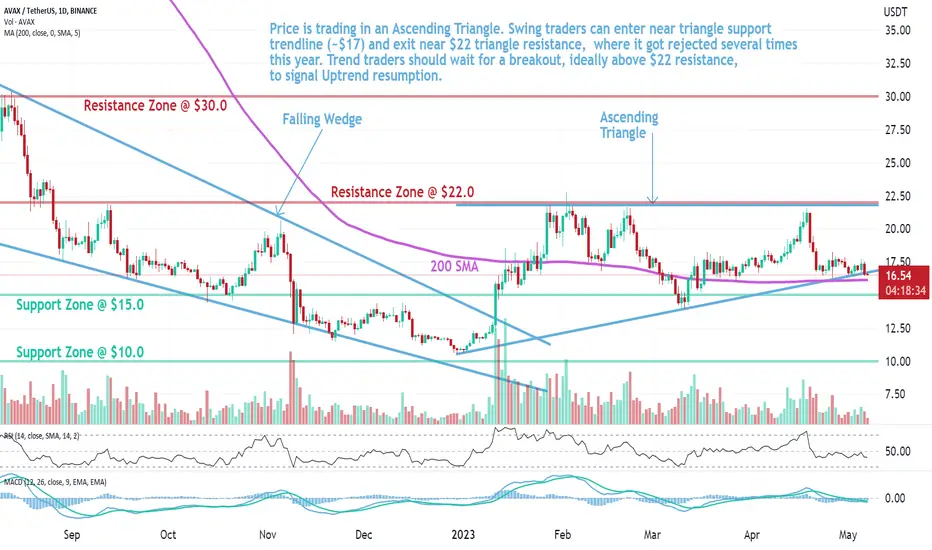
AVAX: Ascending TriangleAvalanche (AVAX) technical analysis:
Trade setup : Price is trading in an Ascending Triangle. Swing traders can enter near triangle support trendline (~$17) and exit near $22 triangle resistance, where it got rejected several times this year. Trend traders should wait for a breakout, ideally above $22 resistance, to signal Uptrend resumption.
Trend : Downtrend on Short- and Medium-Term basis and Uptrend on Long-Term basis.
Momentum is Bearish but inflecting. MACD Line is below MACD Signal Line and RSI is below 45 but momentum may have bottomed since MACD Histogram bars are rising, which suggests that momentum could be nearing another upswing.
Support and Resistance : Nearest Support Zone is $15, (previous resistance), then $10. The nearest Resistance Zone is $22, then $30.
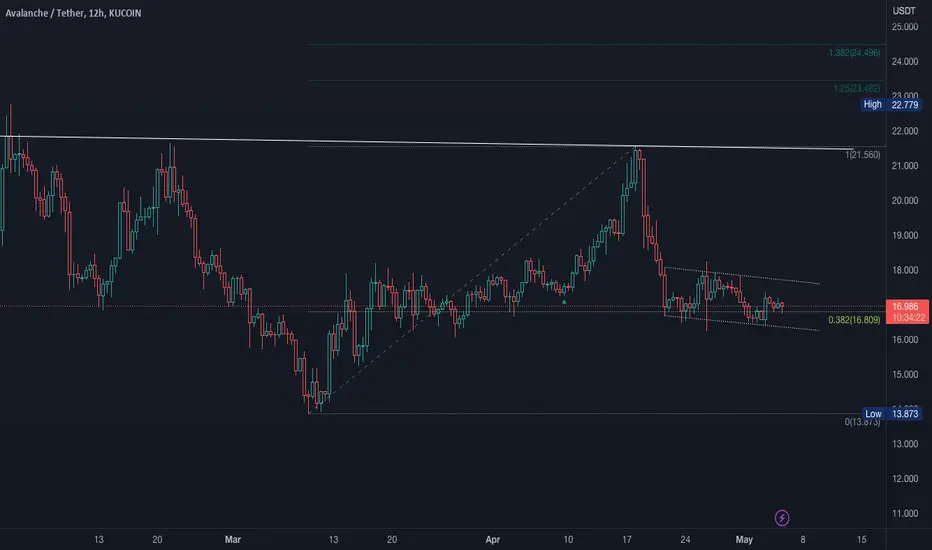
AVAX FLAG!KUCOIN:AVAXUSDT
AVAX sitting in a possible bear flag and looks like retesting the 382 (tempting!).
In consolidation at the moment. Break upwards will provide potential to 21.56 zone.
Break down, look for holding to 13.87 zone.
Uncertainty in US markets with potential of further bank collapses.
Bitcoin will run in this event providing upside to this potential setup.
Key: Let the market show you the direction.
Always having Plan A and Plan B scenarios so we can react once the markets provide an opportunity to execute our edge.
If you liked this idea or if you have your own opinion about it, write in the comments.
The information and publications are not meant to be, and do not constitute, financial, investment, trading, or other types of advice or recommendations.