AVAX: Ascending TriangleAvalanche (AVAX) technical analysis:
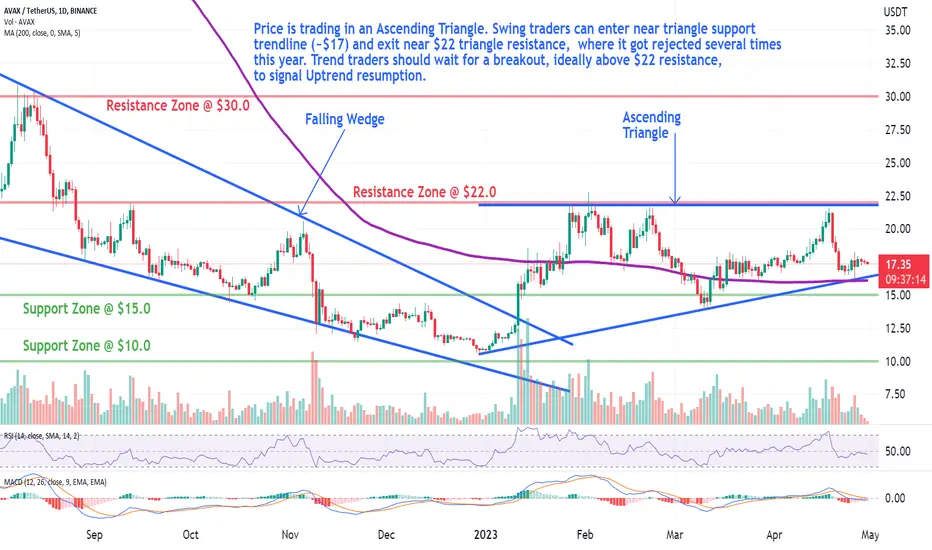
Trade setup : Price is trading in an Ascending Triangle. Swing traders can enter near triangle support trendline (~ HKEX:17 ) and exit near HKEX:22 triangle resistance, where it got rejected several times this year. Trend traders should wait for a breakout, ideally above HKEX:22 resistance, to signal Uptrend resumption.
Trend : Downtrend on Short-Term basis, Neutral on Medium-Term basis and Uptrend on Long-Term basis.
Momentum is Mixed as MACD Line is below MACD Signal Line (Bearish) but RSI ~ 50 (Neutral). MACD Histogram bars are rising, which suggests that momentum could be nearing another upswing.
Support and Resistance : Nearest Support Zone is $15, (previous resistance), then $10. The nearest Resistance Zone is HKEX:22 , then $30.
Avalanche
AVAXUSDT 1HAVAXUSDT 1H
SUPPORTS 18.82 / 18.55
RESISTANCES 19.31 / 20.00
RSI Exhaustion of purchasing forces
MACD: Optimistic
AVAX climbed to the psychological resistance of HKEX:20 and experienced a rejection tonight, returning to levels below that resistance.
On-chain data reveals intense developer activity and growing demand, so I believe that in the next few hours AVAX will go back above psychological resistance and head towards 28, which is my target for the month of April

Volatility Period: April 19-21Hello?
Traders, welcome.
If you "Follow", you can always get new information quickly.
Please also click "Boost".
Have a good day.
** Analysis of the BTC chart publishes new ideas once a week.
** However, we publish new ideas when volatility occurs or when we show signs of diverging from our expectations.
** Excluding the above situation, BTC analysis is listed as a daily update.
-------------------------------------
(AVAXBTC 1W Chart)
The question is whether it can rise above 0.0009 187.
If not, we need to see if it finds support around 0.0006 306 and breaks out of the downtrend line.
-----------------------------------------------
(AVAXUSDT chart)
During the volatility period around April 20 (April 19-21), it is necessary to check whether it can show a move out of the 19.16-23.96 zone.
If not, it should be sideways in the 19.16-23.96 zone to confirm the next volatility period around the 15th of May.
-------------------------------------------------- -------------------------------------------
** All descriptions are for reference only and do not guarantee profit or loss in investment.
** Even if you know other people's know-how, it takes a considerable period of time to make it your own.
** This is a chart created with my know-how.
---------------------------------

AVAXUSDT 1HAVAXUSDT 1H
It continues in an upward trend, giving a show in the graphic analysis! Circulating above MM200 demonstrates clear buyer dominance, plus AVALANCHE has launched a new subnet system called “Evergreen Subnets” which is made specifically for financial institutions. Evergreen subnets will provide blockchain solutions, tools and other services to these big financial players, which will further fuel their rise.
Here are the supports and resistances:
Supports 21.01 / 20.61
Resistances: 21.65 / 22.00
RSI : Seller
MACD: Buyer
MM200: 19.24
EMAS : Pointed upwards, the asset generally follows the movement of the EMAS

AVAX- Breakout to TOP-10 ?? 🔝🔟Well, chart says the breakout scenario could be in play and AVAX is in the top-15 at the moment.
Top-10 will be difficult but potential for 12-13 is in play.
In any case we have a nice set-up for a trade as 19,12 is support.
23$ - 27$ and 40$ are targets for taking profit.
News:
Avalanche Surges to 6-Month High in Daily Active Addresses
The spike coincided with a bevy of financial institutions joining Avalanche’s Evergreen subnet “Spruce.”
Avalanche’s daily active addresses hit nearly 80,000 on April 12. Its daily active user base grew 85% in the past 90 days, making it one of fastest-growing protocols, ahead of BNB Chain, Tron, Ethereum, Aptos and Bitcoin. Only four protocols grew faster, per Artemis: StarkNet, Arbitrum, Stacks and Canto.
The high-water mark coincided with Avalanche’s April 12 partnership with a bevy of financial institutions that will contribute to its network infrastructure, signaling traditional finance companies’ increased interest in the Avalanche ecosystem.
One Love,
The FXPROFESSOR

AVAX/USDT🔵🐇AVAX/USDT
🪄AVAX Scalp Position Based On Fresh Liquidity and Order Blocks and Structures
#avax #avalanche #eth #btc #bitcoin #ethereum #cryptocurrency #crypto #Trade #trading #Trader #Signal #forex #Scalp #altcoins #chart #RTM #ICT
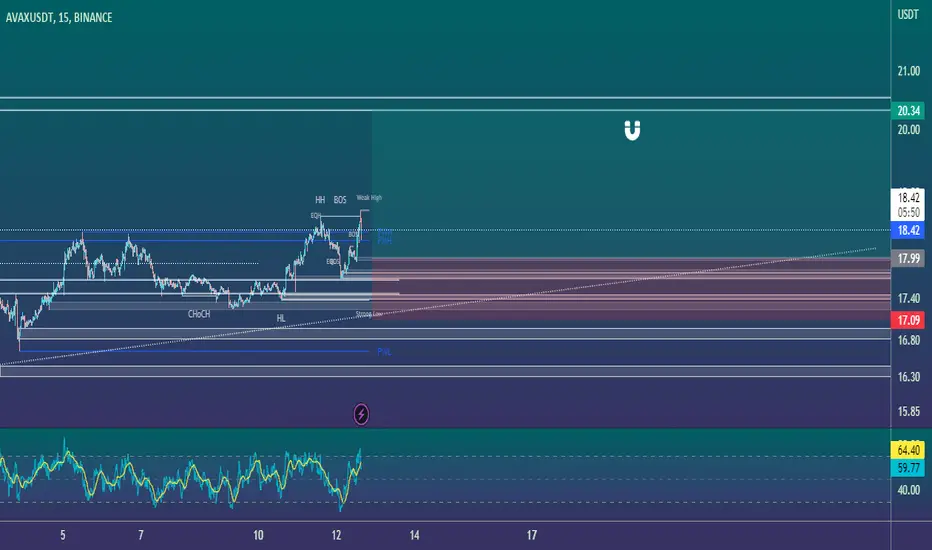
AVAX BUILD UP BREAKOUT!KUCOIN:AVAXUSDT
AVAX price action is squeezing for an imminent move following Bitcoin.
Read my post about Bitcoin earlier today.
Possible upside 20% and if Bitcoin rejects look for shorts to structure.
Higher Lows back into neckline, looking like a possible build up to break out.
Always having Plan A and Plan B scenarios so we can react once the markets provide an opportunity to execute our edge.
If you liked this idea or if you have your own opinion about it, write in the comments.
The information and publications are not meant to be, and do not constitute, financial, investment, trading, or other types of advice or recommendations.
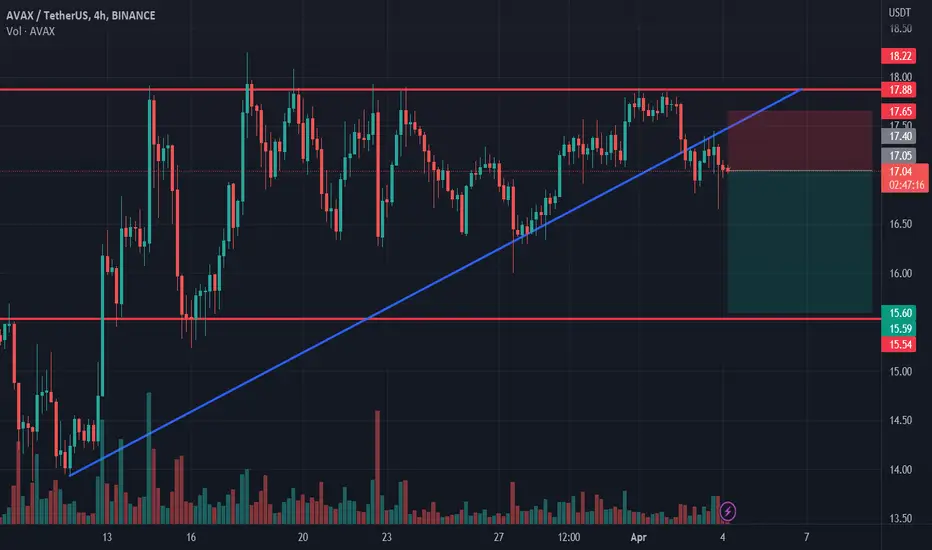
AVAX shortAVAX bounced off the resistance level. Asset broke trough off the ascending trendline. Bearish movement to support level at 15.55 is possible.

AVAXUSD Significant upside potentialAVAXUSD is trading inside a Channel Up having formed a Golden Cross (1d) 6 weeks ago.
The RSI suggests that one last pullback is possible before a new 1 month rally starts.
Trading Plan:
1. Buy on the next pullback to the MA200 (1d).
Targets:
1. 25.00 (top of the Channel Up).
Tips:
1. The ideal buy entry would be when the RSI (1d) hits the 30.00 oversold level again.
Please like, follow and comment!!

AVAX/USDT🐇AVAX/USDT
🪄AVAX looks like bullish with a bullish structure
- you can see scalp setup in the chart
- there are 2 fresh liquidity for Tp
#avax #avalanche #eth #btc #bitcoin #ethereum #cryptocurrency #crypto #Trade #trading #Trader #Signal #forex #Scalp #altcoins #chart #RTM #ICT

AVAX shortAVAX bounced off the resistance level. Asset broke trough off the ascending trendline. Bearish movement to support level at 15.6 is possible.
Potential Wash out before retracement to fulfill bull flag AVAXAvalanche has been in a 10 day range potentially filling out a bull flag formation. After the flag broke on the daily chart the trend became bearish wicking down back into the flag. This does not invalidate the flag, but if you like myself entered Avalanche early in the pole formation you could either exit on that first breakout or hang tight with a stop loss. The absolute level of a stop loss for a longer-term trade would be the red line. The blue lines are key levels within the past few months.

Avalanche FRVP on WeeklyI think FRVP gives a very good result in identifying support and resistance. In this direction, a FRVP that we will apply to the Avax chart in the weekly timeframe shows us that the 17.50 level is support and AVAX is sitting on this support. I think the return from this level in the weekly timeframe is very positive.

🔥AVALANCHE MAY SURPRISE US ALL: 3 LONG TARGETS FOR IT🔥Hi, friends! AVAX may surprise us, because it's one of the most volatile altcoins. What could be better for traders?
Our main task is to find the best entry point. I have already made it for you.
I expect local manipulations and stop hunting both long and short traders, but finally, the price should go lower to shake out retailers who expect the growth.
📊 TRADING PLAN FOR AVAX:
1. test the $15 key level as the support
2. volume growth
3. bullish BTC
✅ MY LONG TARGETS FOR AVAX:
🔥$18 - the local highs and key level
🔥$23 - the local highs
🔥$30 - the even number
💻Friends, press the "boost"🚀 button, write comments and share with your friends - it will be the best THANK YOU.
P.S. Personally, I open an entry if the price shows it according to my strategy.
Always do your analysis before making a trade.


AVAX ♛♘♚ - PROMISING AGAIN🗸🍊First the chart:
Support seems solid at 16.5$ and that is important for a trader.
If Powell doesn't spook the markets today with a big rate hike or a hawkish scary statement we could see AVAX rising to 23$ fast.
Overall, Bullish on AVAX with 56$ being my target.
CHESS MOVE ♛♘♚:
Chess is being played by some of the cleverest people on earth.
So i guess they make a good move with this:
Web3- International Chess Federation Checks Into Web3 With Avalanche Integration
The global chess authority is looking to onboard the game’s 500 million players into Web3 with the new partnership.
One Love,
♖ The FXPROFESSOR ♖

To get out of the bottom section... (19.73 important)Hello?
Traders, welcome.
If you "Follow", you can always get new information quickly.
Please also click "Boost".
Have a good day.
-------------------------------------
(AVAXBTC 1W Chart)
The question is whether it can break out of the downtrend line by rising above 0.0007352.
------------------------------------------
(AVAXUSDT chart)
------------------------------------------
(AVAXUSDT 1W Chart)
If the price is maintained above HA-High, it is highly likely to continue its mid- to long-term upward trend.
Therefore, the key is whether it can rise above 19.73 and be supported.
If not, you should check if it is supported around the HA-Low indicator.
(1D chart)
The key is whether it can be supported around 17.15 and rise above 19.72.
If it fails, you should check for support around 14.99.
The 17.15 point is the HA-High indicator point on the 1W chart, so if the price is maintained above this point, it is highly likely to continue the mid- to long-term upward trend.
However, it needs to rise above 19.73 to continue the upward trend.
-------------------------------------------------- -------------------------------------------
** All descriptions are for reference only and do not guarantee profit or loss in investment.
** Even if you know other people's know-how, it takes a considerable period of time to make it your own.
** This is a chart created with my know-how.
---------------------------------

$avax long | $29 wave 3 min targetavax also looked primed for another waive up.
kind of an inverse head and shoulders set up.
$29 minimum wave 3 target.
should really rip

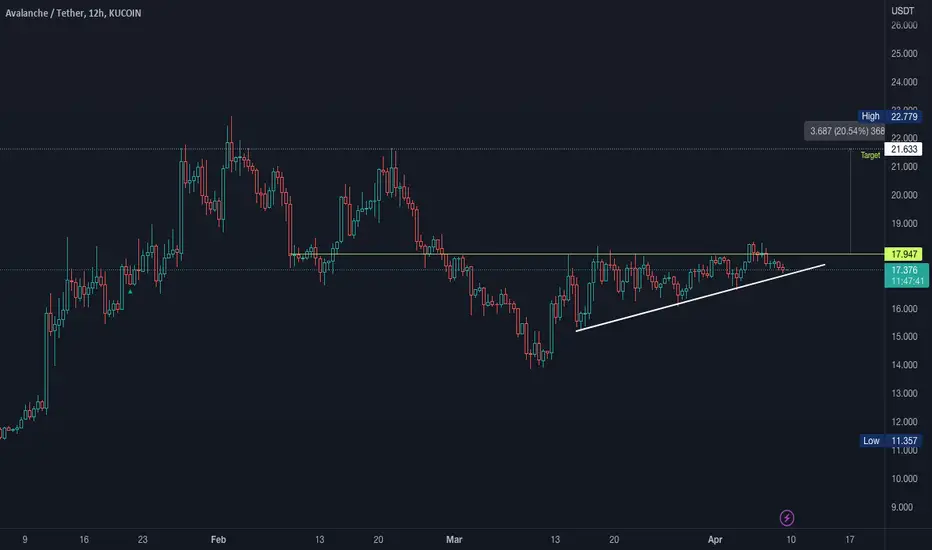
AVAX 100 % gains comingWe expect that the price will get rejected at the strong resistance ($21,600 - $22).
You can short it (stop loss recommended) or be patient and wait for a price to drop into our buy zone ($10-$11). From there we expect a pump towards strong resistance again which would be over 100 % gain.
Mid-term the market remains bearish overall .


$AVAX 📈👀 looks like a little uptick$AVAX 📈👀 looks like a little uptick before breaking the lower low. #Crypto #Avalanche #AVAX 🚀💰💹


Avalanche/US DollarThese are levels that I'll be keeping an eye on when dealing with AVAXUSD, and I'll revise as price action progresses.
I adapt to the change in money flow.
Fundamentals:
Amazon Web Services (AWS) has partnered with Ava Labs in a bid to accelerate the adoption of blockchain technology by enterprises, institutions, and governments.
The move has sent the linked Avalanche AVAXUSD token soaring higher in recent days, outperforming even Bitcoin amid a major bull run in the biggest cryptocurrency.
.....
Seeing that price hit a significant low, potential profit margin resting above current price along with a bearish impulsive followed by a descending channel. I would wait for a break of the $20 & $30 price points and retracement for bullish precursors. We shall see...
