Avalanche

🔥OPEN A LONG WITH +85% POTENTIAL ON AVAX..BUT AFTER A PULLBACK🔥Hi, friends! Now we see that AVAX and BTC are looking bullish, but I expect one more pullback before the pump. This pullback needs to take long traders sl and trap the short traders. More in my new trading plan!
📊 MY TRADING PLAN FOR AVAX:
1. pullback to one of the value areas ($19.53-20.22 or $17-18)
2. volume growth on the pullback
3. bullish BTC
🚩 It's essential to see the huge buy orders of the whales on DOM and Footprint. I use these scalping tools to track the big guys on crypto market and make a profit with them
✅ MY TARGETS FOR AVAX:
🔥 $23 - the key level, local highs
🔥 $25 - the key level, even number
🔥 $36 - technical target according to bull pennant pattern
I would like to see the pullback and make a nice profit!
💻Friends, press the "boost"🚀 button, write comments and share with your friends - it will be the best THANK YOU.
P.S. Personally, I open an entry if the price shows it according to my strategy.
Always do your analysis before making a trade.

Avalanche (AVAX) - pressing resistanceHolding the ascending range eq. and coiling beneath 200ema & monthly open.
Push past 21.5 this week possibly - want to see a breakout soon if so.
Cheers

Crypto , Cryptocurrency You know the DOW theory. In a downtrend, the market moves in three stages;
- Distribution
- Collapse
- Despair and Recovery.
Watch the realization of this theory on the #AVAX #Avalanche chart

AVAX AVALANCHE Daily Chart IMPORTANT VOLUME LVLS Hey guys !! Here you go.
Here are some key VOLUME SUPPORT / RESISTANCE LVLS To Keep your eye on!
Stay safe out there! Spread the LOVE to someone today

AVAX Avalanche Areas of SUPPORT/RESISTANCE BINANCE:AVAXUSDT
Hey ! Here ive charted out some KEY areas of support/resistance to keep an eye out for if you are trading this coin. These are VOLUME areas !
Not financial advice ! just my thoughts .
Lets gett this CRYPTO !!!
BINANCE:AVAXUSDT

AVAX AVALANCHE Price Analysis 4 HOUR CHART Hey there! here are some key levels of support/resistance to keep an eye on!
Pretty simple here.
SPREAD THE LOVE guys ! and stay safe out there!
GHHEEET THAT CRYPTO YO ! $$$
BINANCE:AVAXUSDT

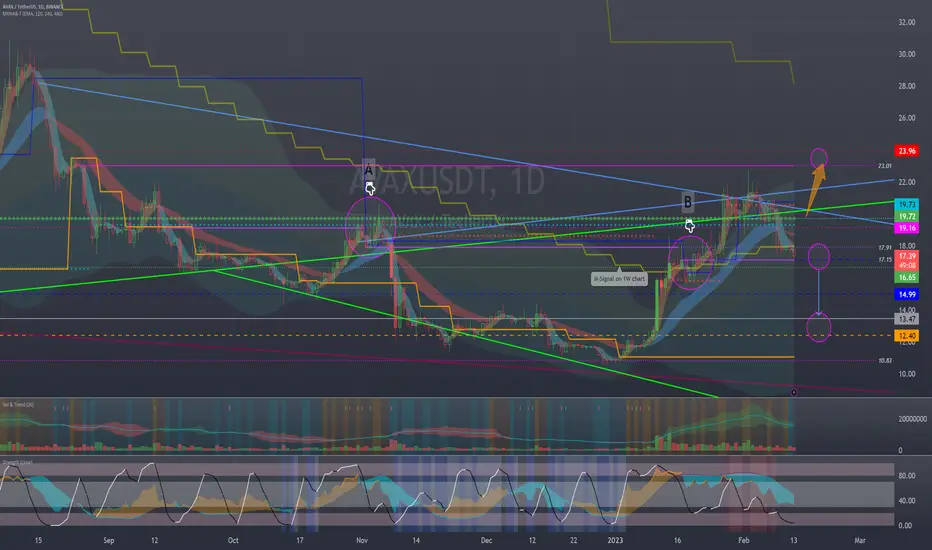
Need to check if it is supported around 16.65-17.91Hello?
Traders, welcome.
If you "Follow", you can always get new information quickly.
Please also click "Boost".
Have a good day.
Thanks for your feedback on the dark mode, I made the chart in black as much as possible to match the colors used in the chart.
Please leave your thoughts on this in the comments.
-------------------------------------
(AVAXBTC 1W Chart)
If it fails to rise above 0.0008 602, I would expect a sharp decline.
--------------------------------------
------------------------------------------
(AVAXUSDT 1W Chart)
The HA-High indicator is looking to be created on 17.15.
Therefore, the key is whether it can be supported around 17.15.
(1D chart)
Being supported and able to rise around 16.65-17.91 is important.
If not, I expect it to decline around 13.47.
-------------------------------------------------- -------------------------------------------
** All descriptions are for reference only and do not guarantee profit or loss in investment.
** If you share this chart, you can use the indicators normally.
** The MRHAB-T indicator includes indicators that indicate points of support and resistance.
** Check the formulas for the MS-Signal, HA-Low, and HA-High indicators at ().
(Short-term Stop Loss can be said to be a point where profit or loss can be preserved or additional entry can be made by split trading. This is a short-term investment perspective.)
---------------------------------
AVAX Avalanche SHORT 1 HOUR CHART !!!SHORT IT UP!???Here's a Quick SHORT Setup for Avalanche
Entry -22.22
Stop Loss -22.80
Target # 1 -20.86
Target # 2 -20.22
I may get stopped out REAL quick! But that's trading for ya ! :) YOU win some and loose some.. Good luck out there today guys !

Trading Idea 024: AvalancheMarket Conditions:
- bullish trend
- consolidation around the resistance
- bullish sentiment in the market
Key Level and Lines:
- $20.00 resistance
Trading Ideas:
- go short if the price stays below the resistance.
- go long if the price moves above the resistance and the crypto market is bullish.

AVAXUSDT - FALSE BREAKDOWN - 4HAVAXUSDT - FALSE BREAKDOWN
If the AVAX does not lose the real body outside the virtual bullish channel, it does not characterize the reversal of the channel. The extremely low RSI reinforces the false breakout.
Rising moving averages suggest that buyers are in charge, reinforced by the RSI. If the buyers do not give up too much from the current level, the probability of a break above $22.79 increases. The AVAX/USDT pair could then attempt a rally to 30.
On the contrary, if the price falls below $19.89, the bullish trough will be undone and the pair could hit the support line at 18.68.
Prognosis as AVALANCHE continues to partner ' In January, Avalanche partnered with Intain, a structured finance platform facilitating more than $5.5 billion in assets across 25+ businesses to manage its digital marketplace IntainMARKETS through the IntainMARKETS subnet.
Used here To plot the supports and resistances, Bollinger Bands which are best on days of high volatility.
Here are the supports and resistances:
Main support levels: 19.57 / 18.62
Main Resistance Levels: 20.99 / 22.12 / 22.79

Avalanche win the cup again?AVAX had a lovely run when they scooped Mackinnon and won the cup, can they go back to back?

AVAX: Resistance BreakoutAvalanche (AVAX) technical analysis:
Trade setup : Price broke out of a Falling Wedge pattern with huge volume, an indication of trend reversal. It also broke above 200-day moving average and $20 resistance. Upside potential to $30. Partnership news with AWS triggered the recent rally.
Trend : Uptrend on Short- and Medium-Term basis and Neutral on Long-Term basis.
Momentum is Bullish but inflecting. MACD Line is above MACD Signal Line and RSI is above 55 but momentum may have peaked since MACD Histogram bars are declining, which suggests that momentum is weakening.
Support and Resistance : Nearest Support Zone is $15, (previous resistance), then $10. The nearest Resistance Zone is $20, which it broke, then $30.

AVAX FLAG!KUCOIN:AVAXUSDT
AVAX has broken the falling wedge and sitting in a Flag with potential targets to 72%
Possible entry on retest of "Breakout" and "Possible Pullback" levels.
As usual, Bitcoin drags the altcoins around.
If you liked this idea or if you have your own opinion about it, write in the comments.
The information and publications are not meant to be, and do not constitute, financial, investment, trading, or other types of advice or recommendations.

AVAX Avalanche 4 HOUR Chart Here are my thoughts on AVAX at the moment.
AVAX is trading in this channel AND NEEDS to hold the SUPPORT at $17.33 IF IT wants to continue to the upside.
If AVAX can get above the 18$ lvl We could see the coin move up to test $19.26.$20-28 areas of resistance!
ON THE FLIPSIDE
IF Avax loses this support then we could see it go back down and test the $16.25 - $17.33 LVL

AVAX Long and Short ScenariosA clear downtrend is observed on the 30-minute chart. When this trend is blended with the moving averages, with the break of the trend, the target is 17.90; With its rejection from the trend, the target is determined to be 17.

AVAX Clear Symmetrical TriangleWhen there's a breakout we gonna short it or long it depends on the breakout. Let's wait for it.

🔥AVALANCHE IS GOING CRAZY: WHAT ARE THE NEXT TARGETS?🔥 Hi friends! Avalance already makes +60% from my entry point, but there are no limits for the price when the bulls are so strong.
📊 MY TRADING PLAN FOR AVAX:
1. return to the $17-17.5 value area
2. squeeze to the local trendline and breakout
3. bullish BTC
4. volume growth on correction
🚩 It will be better for the price to fall lower, maybe below the value area. In this case, a lot of sl will be collected.
✅ MY TARGET FOR AVAX:
🔥 $20.6 - the key level and local target
🔥 $22 - the key level
🔥 $25 - key level and even number
Traders, what coins do you expect to be top gainers in this bull market? Write the ticker in the comments!
💻Friends, press the "boost"🚀 button, write comments and share with your friends - it will be the best THANK YOU.
P.S. Personally, I open an entry if the price shows it according to my strategy.
Always do your analysis before making a trade.

🔥AVALANCHE IS MAKING A FALSE BREAKOUT! DON'T MISS THIS PUMP 🔥 Hi friends! AVAX is the most volatile altcoin and I think it gives us one more chance to make +10-15% on it. Now the price make a false breakout and if BTC will go up, the long will give us at least 1:5-10RR.
📊 MY TRADING PLAN FOR AVAX:
1. false breakout of the key level of $11.15
2. volume divergence
3. bullish BTC
🚩 Persolnally I use DOM and Footprint to identify the whales who buy crypto. These scalping tools help me to track their real orders. Watch my free video guides.
✅ MY TARGET FOR AVAX:
🔥 $11.5-12 - the value area
🔥 $12.5 - the key level
🔥 $12.8-13.3 - the value area
Traders, it seems like now or during the 2 closest bars we have a chance to open a long trade.
💻Friends, press the "boost"🚀 button, write comments and share with your friends - it will be the best THANK YOU.
P.S. Personally, I open an entry if the price shows it according to my strategy.
Always do your analysis before making a trade.

Avax potentially breaking up from a falling wedgeIf price action can flip this green trendline to solid support the price could climb to the $28 target within the next month or 2. Fundamentally, one of the reasons for this pump is that Amazon Web Services (AWS) has partnered with Ava Labs, the company building out layer-1 blockchain Avalanche, to help scale blockchain adoption across enterprises, institutions and governments.
“Looking forward, web3 and blockchain is inevitable,” Howard Wright, VP and global head of startups at AWS, said. “No one can call the time or date or quarter that it’s going to happen and it’ll be mainstream, but we’ve seen the cycles of growth before. The velocity of this one seems like it’s accelerating and we’re just excited to be a part of this.”
The partnership intends to make it easier for individuals to launch and manage nodes on Avalanche while also aiming to give the network more strength and flexibility for developers.
AWS will support Avalanche’s infrastructure and decentralized application (dApp) ecosystem, alongside one-click node deployments, through its marketplace. The affiliation will also include Ava Labs joining AWS Activate, a program that helps startups and early-stage entrepreneurs get started on its platform. All this should lead to sustaining bullish momentum for avalanche. *not financial advice*

AVAX down 90%, perfect opportunity for huge gains!AVAX crashed by 90% which can lead to the rise with huge gains. Price still in downtrend channel, but recently it showed bullish engulfing and moving to resistance of the channel where I am expecting rebound to support zone.

AVAX Daily SupportsIn the daily timeframe, AVAX's continued upward trend seems to have come to an end for now. After reaching the $18.60 level, it sold up to $17. With the continuation of this sale, if the day closes below the level of $ 16.16, it can be entered in the range of $ 16-14. This correction will give investors a buying opportunity. If it does not close below this level, there is a possibility that the rise will continue.

AVAX❄️ triangle breakoutAvalanche broke up this triangle📐 and I think there is chance for run to 19.43 and even higher. Setting BUY LIMIT order to previous range high to catch🎣 the pullback.
ENTRY : local high @ 17.34
STOPLOSS (SL) : local low @ 16.06
TARGET (TP) : height of the triangle projected from midpoint of the local range (BUY LIMIT - STOPLOSS) @ 19.43
REWARD RISK RATIO (RRR) : 1.63
INVALIDATION : when SL level hit
Check my other stuff in related ideas.
Please boost🚀, comment🗣️, follow me✒️, enjoy📺!
⚠️Disclaimer: I'm not financial advisor. This is not a financial advice. Do your own due dilingence.
