AVAX: analysis for September 13The resistance level with the upper border of $20.60 was broken on the Daily timeframe on September 11. The trend is bullish now and the impulse wave develops.
A pullback buying opportunity will appear after the correction formation on the Daily timeframe. The new resistance level that can be formed around these price marks or the highs of August 23 – 26 will be the target for the bullish movement continuation after the correction is finished.
In case of successful development of the trend, a more distant target will be on the highs of August 12 – 14, where the next resistance is located with the borders of $29.45 – $30.35.
When breaking through the support, the trend will reverse and we should look for selling opportunities. The borders of this level are $17.90 – $18.25.
Longs will remain relevant until the market is above the nearest support level on the Daily chart, the lows of September 6 – 7.
Avalanche

Avax buy zonesBased on time and price analysis, I showed two important buy zones in the chart.. faster time means lower price and vice versa...

avalanche 2022heres my avalanche chart for the next few hours im going to be after i post the charts i want to show----if you long go getter=) bud---but be smart---

📊 Avalanche(AVAX) give you a chance: where to open a long?Hi friends! Another altcoin make a pullback and give you the opportunity to open a nice long.
✅AVALANCHE is close to the biggest value area which become the huge support if BTC fall to $17500. As you all know the alts follow BTC.
Now the price consolidate inside the triangle and broke it down woth high possibilitty. This is your chance to enter the long. 📊 Preconditions to open a long:
🔥 false breakout of the triangle or test the huge support area of $15.6-17
🔥 squeeze to the upper trenline
🔥 volume growth which confirms the pressence of buyer
🔥 bullish BTC
🚩 Additionall precondition for me will be the HUGE buy orders of the whales. They appear when the price reach the huge support levels like this. I prefer to open the trade in the same direction with the big players.
📊 The targets:
1. $20.49 -the key level and even number.
2. $23-25 - the value area and HUGE resistance. I thimk after such big accumulation it will be easilly broken.
💻Friends, press the "boost"🚀 button, write comments and share with your friends - it will be the best THANK YOU.
P.S. Personally, I open an entry if the price shows it according to my strategy.
Always do your analysis before making a trade.

Trading opportunity for AVAXUSDT AvalancheBased on technical factors there is a Long position in :
📊 AVAXUSDT Avalanche
🔵 Long Now or by Breakout
🧯 Stop loss 16.91
🏹 Target 1 23.50
🏹 Target 2 27.20
💸Capital : 1%
We hope it is profitable for you ❤️
Please support our activity with your likes👍 and comments📝

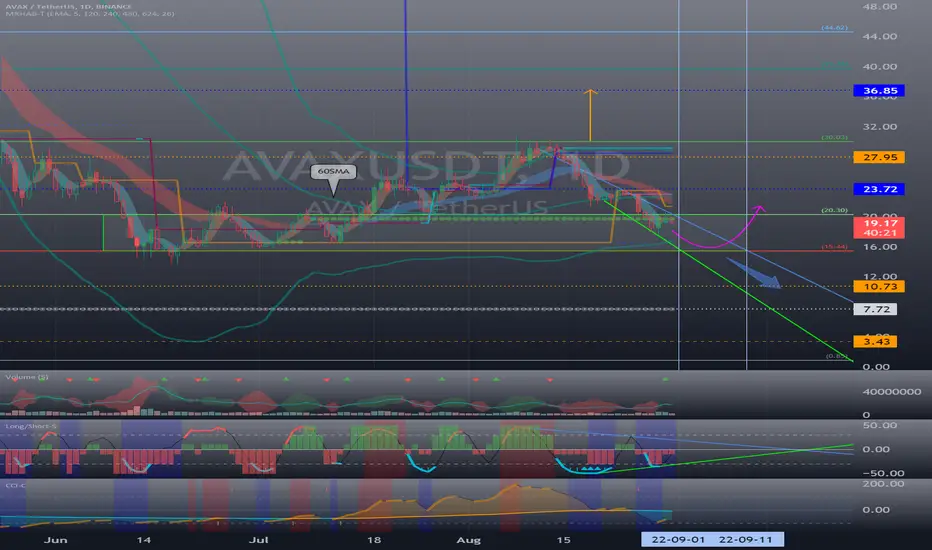
Avalanche (AVAX) - September 1Hello?
Welcome, traders.
By "following", you can always get new information quickly.
Please also click "Like".
Have a good day.
-------------------------------------
(AVAXUSDT 1W Chart)
The key is whether the 15.44-20.30 zone is supported and able to rise.
(1D chart)
To get out of the downtrend channel, we need to see if we can find support in the 15.44-20.30 zone.
In particular, you need to make sure that the price remains above 20.30 after around the 9th or 11th.
If they can't get out of the bearish channel, they could move towards the 7.72-10.73 section.
------------------------------------------------------------ -------------------------------------------
** All descriptions are for reference only and do not guarantee a profit or loss in investment.
** The MRHAB-T indicator, which is inactive on the chart, contains indicators that indicate support and resistance points.
** Background color of Long/Short-S indicator: RSI oversold and overbought sections
** Background color of CCI-C indicator: When the short-term CCI line is below -100 and above +100, oversold and overbought sections are displayed.
** The OBV indicator was re-created by applying a formula to the DepthHouse Trading indicator, an indicator disclosed by oh92. (Thanks for this.)
(Short-term Stop Loss can be said to be a point where profit and loss can be preserved or additional entry through split trading. It is a short-term investment perspective.)
---------------------------------

avalanche 2022heres my avalanche chart for the next couple of hours---possibly 10-16 hours---going to leave it an see how things play out..

🔥AVAX: risky trade, but worth it!Hi friends! AVAX got reputational problems and are accused of fraud. Due to this many hodlers of this coin have already sold it out and price fall to the $16-18.5 value area.
I think with high possibility the price will go lower to the local lows, especially if this scenario for BTC will happen. In this case all alts will fall to their local lows.
📊 Preconditions to open a long:
🔥 fall to the $13.71 key level
🔥 volume growth which confirm the pressence of buyer
🔥 bullish BTC
🚩 The main thing is to find the support by the whales, where the price can make a reverse and pullback. If i will see the HUGE orders wall to BUY, I`ll also try to enter the trade with the whales.
📊 The targets:
1. $23-25 - value area
2. $30 - key level, long term target
💻Friends, press the "boost"🚀 button, write comments and share with your friends - it will be the best THANK YOU.
P.S. Personally, I open an entry if the price shows it according to my strategy.
Always do your analysis before making a trade.

Roadmap for AvalancheFrom the swing low, we have made what appears to be 5 waves up.
Looking for the completing of the 5th wave down on this local trend to end around 19.80s before we see a bounce.
Ultimately looking for a major bounce at 16$ at AVAX's favourite fib level.

DOM and FP: this indicator show the best ENTRY point on AVAX🔥Hi friends! As we can see at hte volume indicators, a lot of traders buy the dip at AVAX. I marked two arreas where long the positions were accumulated by whales. If the price return to this area, it will be supported bu the whales because they want to protect their buying price.
So, in this case we can expect the pullback with amazing entry point close to the $15.5-18 value area. If i will see the HUGE whales orders on the DOM and Footprint indicators, I open nice long with short stop loss and 1:8-10 RR.
📊 Preconditions to open a long:
🔥 pullback to the $15.5-18 value area
🔥 huge BUY orders on DOM and Footrpint
🔥 volume growth at the volume indicator which confirm the pressence of buyer
🔥 bullish BTC
🚩 If BTC will fall to $19 500 - 20 000 area and will also be supported by the whales, it will be reversal point for all cryptocurrencies. In this case, all alts will make a huge PUMP.
📊 The targets are the key levels:
1. $31
2. $38
💻Friends, press the "boost"🚀 button, write comments and share with your friends - it will be the best THANK YOU.
P.S. Personally, I open an entry if the price shows it according to my strategy.
Always do your analysis before making a trade.

Avalanche shortAvalanche broke trough the support area. Asset broke trough the ascending trendline. Bearish movement to support level at 17 is possible.

avax scalp long | tp $26closed all shorts this morning. will look to reopen post bounce.
going to be away from my desk all day, so this is the only chart i'll be posting. I like avax for the bounce here.
strong bounce off eth pair support and held overnight vs usd while everything else dumped.
if we get even the slightest bit of recovery here, avax should be high beta.

Avalanche (AVAX) - August 20Hello?
Welcome, traders.
If you "follow", you can always get new information quickly.
Please also click "Like".
Have a good day.
-------------------------------------
(AVAXUSDT 1W Chart)
The key is whether you can keep the price above 20.30.
(1D chart)
The key is whether it can move higher than 23.72.
Otherwise, it is expected to decline to the 15.44-20.30 section.
A move above 23.72 is expected to lead to an attempt to move above 30.03.
- The RSI indicator, the Stoch RSI indicator, and the CCI indicator are all in the oversold zone.
So, it's a good idea to check the movement until you start breaking out of the oversold zone.
- Aggressive buying is currently possible, but if you are unfamiliar with short-term trading, it is not recommended to challenge it.
------------------------------------------------------------ -------------------------------------------
** All descriptions are for reference only and do not guarantee a profit or loss in investment.
** The MRHAB-T indicator, which is inactive on the chart, contains indicators that indicate support and resistance points.
** Background color of Long/Short-S indicator: RSI oversold and overbought sections
** Background color of CCI-C indicator: When the short-term CCI line is below -100 and above +100, oversold and overbought sections are displayed.
** The OBV indicator was re-created by applying a formula to the DepthHouse Trading indicator, an indicator disclosed by oh92. (Thanks for this.)
(Short-term Stop Loss can be said to be a point where profit and loss can be preserved or additional entry can be made through split trading. It is a short-term investment perspective.)
---------------------------------

short it all to zero | $avax to $22exited all longs with this pump. was mainly in eth as wee moved avax long profits to eth a few days ago.
don't think avax takes out the high. was the final momentum pump we were looking for.
next two weeks or so expecting all downside action.
just about everything should be a safe short from here.

Avalanche: The Very Hungry Caterpillar 🐛You know the children’s book The Very Hungry Caterpillar by Eric Carle? Just like the story’s protagonist, Avalanche is crawling around with wriggly movements and is repeatedly gnawing at the turquoise zone between $25.29 and $39.63. If the altcoin wants to further our primary scenario, though, it should pupate soon and emerge as a beautiful butterfly, flapping away above the resistance at $103.64. However, there is also a chance that Avalanche could lose its footing and drop below the resistance at $9.25, which would then elicit a strong downwards spiral.


$avax short vs eththink all markets are essentially topped, so looking for best shorts. avax looks like it's at heavy resistance here vs eth. think it's likely the better short.
should drop ~10% vs eth.

Avalanche shortAvalanche broke trough the ascending trendline. Asset broke trough the support level. Bearish movement to support level at 22.28 is possible.

AVAXHELLO GUYS THIS MY IDEA 💡ABOUT AVAX is nice to see strong volume area....
Where is lot of contract accumulated..
I thing that the Buyers from this area will be defend this Long position..
and when the price come back to this area, strong Buyers will be push up the market again..
uptrend + Support from the past + Strong volume area is my mainly reason for this long trade..
IF you like my work please like share and follow thanks
TURTLE TRADER 🐢

AVAX rise by 123%🔥 Will the party continue❓Hi friends! Avalanche is already rise by 123% from it`s bottom. By the way BTC made +40%.
Now the price is inside the wedge and ready to break up from one side. But AVAX need to make a pullback to cool down. This is a chance to open a long for us.
If the price fall to the closest value area it should become the support. The second support is lower boundary of the wedge. These two layers can stop the fall and let the alt to cool down before the growth to the new targets.
📊 Preconditions to open a long:
1. local pullback to the $23-25.5 value area and lower border of the wedge
2. volume growth which confirms the big players pressence
3. BIG ORDERS by the whales on DOM and Footprint. If the big orders apear it`s a big chance to the AVAX to continue it`s growth because the whales won`t let the price to fall.
4. bullish BTC
📊 The targets are a key levels:
🔥 $40 - closest resistance
🔥 $50 - even number
🔥 $70 - local high
💻Friends, press the "like"👍 button, write comments and share with your friends - it will be the best THANK YOU.
P.S. Personally, I open an entry if the price shows it according to my strategy.
Always do your analysis before making a trade.

long AVAXCorrection on $AVAX stopped around the 0.5 Fibonacci level. Bullish trend is expected to continue and reach the 30$

$avax target remains $28-30should have stuck with this game plan as avax bounce right at our w4 completion zone.
still targeting $28-30 minimum.
only area i'm concerned about is the ? white box. rejection there would signal another wave down and likely the end of this bull run.
until then, long your longs.
avax vs eth for additional context. think avax outperforms again:
