AVAX to re-test the $39 IF we hold $27 as support. AVAX has been massively oversold and undervalued for the last few months.
We've seen a strong relief rally thus far that may be sustained until $34 - $39 IF we can turn $27 into support.
If $27 does not turn into support and BTC and ETH see a correction, we could see price action for AVAX take another dive down to the low 20s.
Avalanche

$avax longplaying this level by level. currently holding above wave 1, which is what we'd like to see for a wave 4, with wave 5 coming up.
marked this green box last week as potential support.
looks to be holding.
wave 5 should put us around $28.

AVAXUSDT 1D Medium-term trade - our target $30We are already forming a series of ideas on the AVAXUSDT trading pair.
We published the last of them a week ago.
During the week, our assumptions are confirming that the AVAXUSDT trading pair is currently consolidating with a set of long positions. The trading delta shows the superiority of purchases over sales in the period from 06/26 to 07/13
Also, for almost a month, the Avax price has been consolidating above the critical support level above $15.
Such input data for Avalanche token price gives the right to enter a medium-term trade:
Entrance $16.50
Stop $14.54 (-12%)
TP1 (50% position) - $26.74 (+62%)
TP2 (50% position) - $29.94 (+82%)
P/L ratio 7/1
Fixing the AVAXUSD price below 15 dollars paves the way for the price to fall to the region of 12 dollars.
_______________________________
Since 2016 , we have been analyzing and trading the cryptocurrency market.
We transform our knowledge, trading moods and experience into ideas. Each "like under the idea" boosts the level of our happiness by 0.05%. If we help you to be calmer and richer — help us to be happier :)

AVAXUSD breakout, could this be the start of a new move higher?Hi, welcome to Monday's update. Today's focus is on AVAXUSD after last weekend's solid two days of buying that broke above resistance
Are we seeing a new higher extension on AVAXUSD? That is the question we're asking in today's video update. Weekend trade has set up the first sign with a break above 25.30 resistance. What we would like to see now is for the move to continue higher and test the next resistance levels seen at 27.50, 31 and 36.
In a perfect world, we would see price continue to push higher a bit more before we see a new pullback. We are looking for the pullback to find support at the previous breakout point and turn the previous resistance level into new support.
A new HL created around the previous level of resistance followed up by a new HH would be a good sign and could signal a buy into the new move. From that point, we would like to see buyers break 31 and 36 resistance to signal that a new short-medium-term trend higher is underway.
A new lower move closing below 25 would be a worry and could tell us that buyer momentum might not be as strong as thought.
Good trading, and enjoy the rest of your Monday.

Avalanche (AVAX) - August 8Hello?
Welcome, traders.
By "following", you can always get new information quickly.
Please also click "Like".
Have a good day.
-------------------------------------
(AVAXUSDT 1M Chart)
The key is whether it can rise above the 39.76-44.62 section.
To do that, you need to keep the price above the 15.44-20.30 range.
(1W chart)
Primary resistance: 30.03
Secondary resistance: 39.76-44.62
Support: 15.44-20.30
The intervals 15.44-20.30 and 39.76-44.62 are the intervals that determine the trend.
So, if you hold the price above 20.30, it is likely to move above 39.76.
To that end, the key is whether it can be supported by rising above 30.03 in the first place.
(1D chart)
Primary resistance: 27.95-30.03
Secondary resistance: 36.85-39.76
1st support: 23.72
2nd support: 15.44-20.30
The RSI and Stoch RSI indicators are entering the overbought zone.
Therefore, it is necessary to check where support and resistance are found when exiting the overbought zone.
If you fail to break above the 27.95-30.03 section, you should check to see if there is support around 23.72.
If it rises above 30.03 and finds support, it is likely to lead to a move towards the 39.76-44.62 section.
Therefore, the key issue is whether it can rise above 30.03 and receive support.
--------------------------------------
If you look at the 1M chart, you can see that there has been a huge decline.
Therefore, it is not easy to invest even if it shows an upward trend on the 1D chart.
However, if you are not investing now, it is highly likely that you will start investing when it rises to the 39.76-44.62 range.
The 39.76-44.62 interval is the interval that determines the trend.
So, if it moves above 44.62, it will continue its uptrend, but if it doesn't, it will go downhill.
The closer you get to this important support and resistance zone, the more likely the peak will be when you feel compelled to buy now.
Conversely, if you buy, the area that is more likely to decline is more likely to be the bottom.
Between this bottom section and the section where a full-fledged uptrend starts, it is a good section from a mid- to long-term point of view, no matter where you buy.
However, when a further decline occurs, it is important to secure adequate cash because a better opportunity may be missed due to a lack of cash.
In that sense, the method I recommend is
- Buy when the price moves sideways or when the price falls at a certain rate (for example, when it falls by -10% or -20%),
- When the price rises and receives resistance in the resistance section, sell when it rises at a certain rate (for example, when it rises by 10% or 20%).
This is a method to increase the number of remaining coins (tokens) with a small amount of cash profit by selling with the purchase principal (+ transaction fee x 2 ~ transaction fee x 20 included) when selling.
Cash management is important because this method has to be continued until the start of a full-fledged uptrend, so if you buy using too much cash at once, you may run out of cash.
Since the coin (token) secured in this way has an average purchase price of 0, it is always in a state of profit until the price becomes 0.
From a mid- to long-term perspective, the need to increase the number of coins (tokens) is to increase these coins (tokens).
------------------------------------------------------------ -------------------------------------------
** All descriptions are for reference only and do not guarantee a profit or loss in investment.
** The MRHAB-T indicator, which is inactive on the chart, contains indicators that indicate support and resistance points.
** Background color of Long/Short-S indicator: RSI oversold and overbought sections
** Background color of CCI-C indicator: When the short-term CCI line is below -100 and above +100, oversold and overbought sections are displayed.
** The OBV indicator was re-created by applying a formula to the DepthHouse Trading indicator, an indicator disclosed by oh92. (Thanks for this.)
(Short-term Stop Loss can be said to be a point where profit and loss can be preserved or additional entry through split trading. It is a short-term investment perspective.)
---------------------------------

Avalanche teasing an inverse head and shoulder breakoutWaiting to see where the current candle closes. Seeing priceaction flip the 1day 50ma (in orange) to support would make me more confident of the breakout. If breakout confirms target should be around $28.

Avalanche - AVAX/USD Chart Analysis - Elliot Wave and Price ActiPrediction:
Buy AVAX/USD @ 27
Target 1 - 70
Target 2 - 140
Stop Loss - 19

head and shoulders forming on the monthlytake the money and run! this is the pump before the dump; needs to come way down.

Avalanche Coin What's next ? Hi Traders , please if you like ideas do not forget to support it with your like and comment , thank you so much and we will start stay tuned for new ideas. Every day I post profitable ideas a day.

$avax gonna melt faces. 120 day downtrend breakout/retest is finally ready.
think it'll outperform just about everything.
we simply melt up.

Ichimoku analysis of AVAXabout to pop out of the cloud. Keep an 👀 over the closing price. Closing above 23.9 will be good.

AVAX BULLISH SOON?From an analyst standpoint, there is a chance that the crypto market seems to be making a correction as sell-side delta has accumulated heavily and we might be due to seeing a short squeeze soon.
Avax looks to be heading down to the bullish trendline area I am looking at those Fibonacci levels as a potential entry but also be aware price may manipulate the daily trendline to take out buy stops and move up.

AVAX 4h Chart AnalysisAvalanche broke the Symmetrical Triangle upwards and now at the $25.50 resistance. Relying on the Fibonacci, if AVAX stay above $23, it's likely to see it to break $25.50 resistance. If that happens next target is $28.

Avalanche AVAX long Entry Range, Take Profit and Stop LossAVAX/USDT
Entry Range: $24.00 - 25.90
Take Profit 1: $27.30
Take Profit 2: $33
Take Profit 3: $38.90
Stop Loss: $19.90
AVAX short

$avax | long | target $28-30like bitcoin, no real divs to work with. but retesting rsi eq on the daily. don't think we've hit the real swing top.
retraced to standard wave 4 zone.

Avalanche (AVAX) - July 27Hello?
Welcome, traders.
By "following", you can always get new information quickly.
Please also click "Like".
Have a good day.
-------------------------------------
(AVAXUSDT 1W Chart)
The key is to find support in the 19.79-23.96 zone and move higher than 32.23.
If it falls below 19.79 and finds resistance, then it is likely to drop below 13.47, so trade cautiously.
(1D chart)
Primary resistance: 30.32-32.23
Secondary resistance: 43.66
1st support: 19.79-23.96
2nd support: 13.47-16.56
- The RSI indicator is falling out of the overbought zone.
- The Stoch RSI indicator is located in the oversold zone.
So, if you find support near 19.79 when you break out of the oversold zone, you would expect a short-term uptrend.
However, it may temporarily touch the 19.79 area and move higher, so you need to trade cautiously.
- In the CCI-C indicator, if the CCI line is maintained above the EMA line, it is likely to show an upward trend.
Therefore, it is necessary to ensure that the CCI line remains above the EMA line.
------------------------------------------------------------ -------------------------------------------
** All indicators are lagging indicators.
Therefore, it is important to be aware that the indicator moves accordingly with the movement of price and volume.
However, for the sake of convenience, we are talking in reverse for the interpretation of the indicator.
** The MRHAB-T indicator used in the chart is an indicator of our channel that has not been released yet.
** The OBV indicator was re-created by applying a formula to the DepthHouse Trading indicator, an indicator disclosed by oh92. (Thanks for this.)
** Support or resistance is based on the closing price of the 1D chart.
** All descriptions are for reference only and do not guarantee a profit or loss in investment.
(Short-term Stop Loss can be said to be a point where profit and loss can be preserved or additional entry can be made through split trading. It is a short-term investment perspective.)
---------------------------------

$avax | twenty american greenbacksranged under the high and ultimately rejecting. expecting a slightly extended wC to bring us down to $20, where we're looking for w5.

$avax still short. currently failing our retest zone similar to eth. btc didn't even make it up to it's retest zone, which makes me think this could bleed a little further than wave a did in comparison.
invalidation above the high. still want $20.

$AVAX 1D levels update25.8 stays key
close above could be worth longing otherwise play it back down to lows
only had a few trades w this as mainly traded $APE and $ETH
ww

$avax thank you this opportunitythank you for this opportunity to add to our avax short at this resistance. ecb rate hike lol like anyone cares about the euro.
nuke this back down to $20 with haste.

$avax btc shorttypically don't draw out the triangles, but this one's so pretty.
one of many pairs that looks topped.
btc, as always, will hold up better than alts during this move down.

avax short to $20similar idea to the eth short. wave 3 looks complete, with valid bear divs on rsi.
looking for ~20% pull back to $20 or so before a big push up to $28-30.

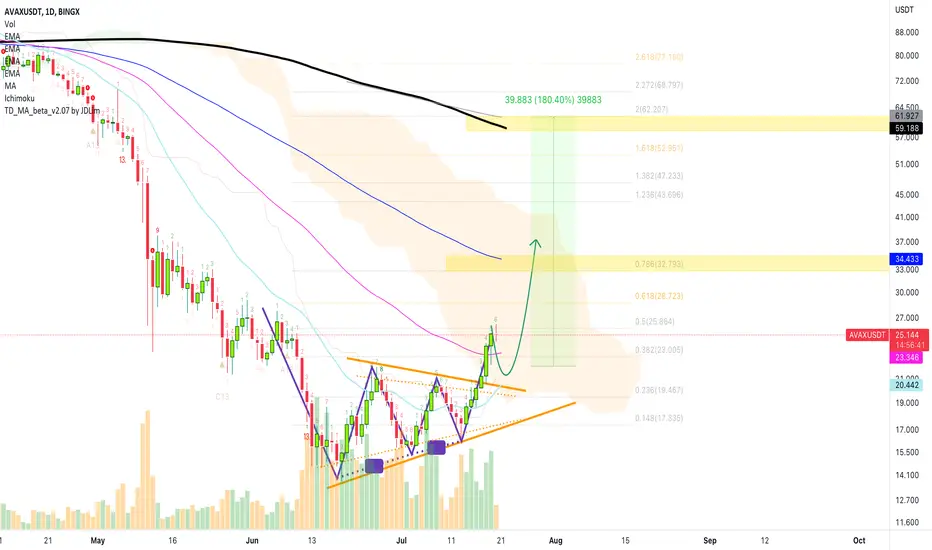
Avalanche Breaks Bullish Consolidation Pattern (180%+ Potential)Avalanche (AVAXUSDT) broke out of a bullish consolidation pattern after 6 days of green.
Monday EMA50 was conquered and yesterday this same level was tested as support and holds.
We have can a small retrace before higher prices but it is also possible to see straight up.
The potential is huge for AVAXUSDT at 180% for the next bullish jump.
You can see the targets and additional information on the chart.
Namaste.