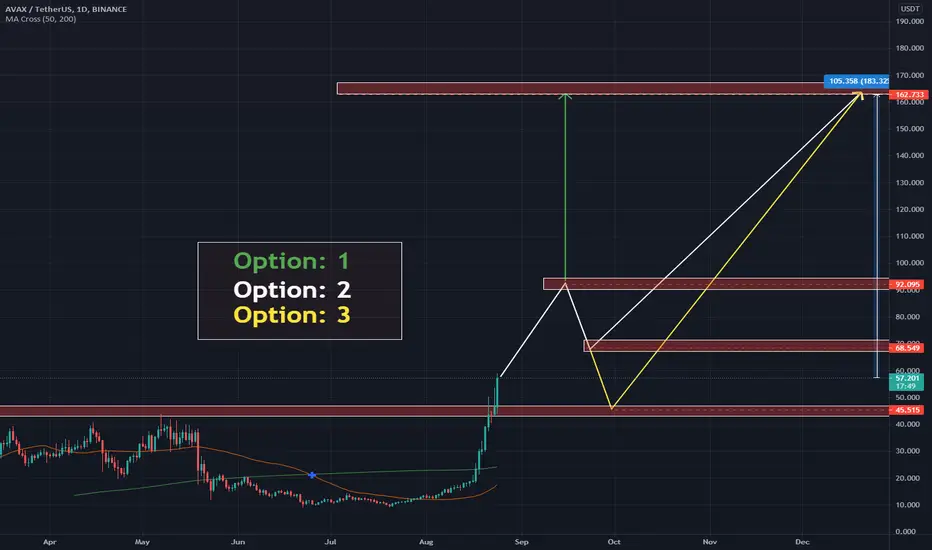
AVAX - Option 1-2-3 Target 170$ (1D) - Final Target ~ $400AVAX - Option 1-2-3 Target 170$ (1D)
Do you think????
Option 1 - Green Wave: ALL in One HIT
Option 2 - White Waves: Takes more time
Option 2 - Yellow Waves: Takes a little longer
P/s: Final Target for Holder ~ $400
Avalanche
Avalanche (Avax) Update: Since the Buy signal from the ema and sma cross signalled on the 1st August, Avalanche (Avax) has been on a impulsive parabolic run, gaining over 400% in just over 24 days. Currently Avax is 10% from the ATH price @ $59.74, the price next target from here is at the 127.20% fibonacci level @ $73.49, 34% from the current price level. Please see previous analysis below. Happy Trading :)
Avalanche (Avax) Update 21/03/21, be patient 63%+ Gain to ATH $59.7. $AVAX
Update 10/03/21 on Avalanche (Avax) BUY triggered by script 13EMA crossing up 50SMA
Avalanche (Avax) BUY triggered by script 13EMA crossing up 50SMA, 90% gain from current price level back to ATH price level! Bulls back in the market!
Avalanche (Avax) Buy Opportunity 90%+ Gain Triple Bottom Formed, Stochastics on the Weekly still showing a buyers market with a strong bullish sentiment short-midterm. Avax's price soared to a new ATH on 10/02/21 @ $59.7 and has since retraced from this huge explosive parabolic move forming a triple bottom. The stochastics on the Daily chart and 4H both show an extremely oversold market, further the triple bottom signifies that the Bulls are coming into play and this could be the sign of recovery back to the ATH levels previously set on 10/02/21. Currently the price level has tested and broken just above the 200 SMA signalling bullish sentiment but a possible test back to the 200 SMA and a break below this level would signal a strong signs of a some retracement or consolidation short-term. A trigger of the 13 EMA crossing up 50 SMA would be another confirmation of this move back towards to upside, gaining 90%+ on its way back to ATH levels and a possible push further to the 127.20% Fibonacci level and a new ATH @ $70.
Use the buy zones area to map out Buys from zone 1 below the 23.30 Fib level and zone 2 between the 23.20% & 38.20% Fibonacci level. Happy trading :)
Key Notes on this project:
Avalanche is an open-source platform for decentralized finance (DeFi) applications and enterprise solutions. Developed and launched in late September by Ava Labs, the team raised a total of $60 million across three separate sales. The Block has identified 54 projects and companies across 11 different verticals currently expanding on its ecosystem.
Capped Supply
An important characteristic of a store of value is scarcity. Unlike most other staking platforms which have an unlimited supply and continuously increase their supply at a compounded rate, Avalanche has a fixed capped supply of 720 million, creating scarcity. 360 Million tokens were minted at launch (with the vast majority locked up in vesting periods between 1 and 10 years) whilst the other 360 million are used for rewards for staking. As with Bitcoin , reward rates will decrease over time as it gets closer to the capped supply (although at a much smoother rate rather than infrequent halvings).

flag pattern scenarioit could slide to $25 and neutral between $25 and $37 for a while to prepare for $84

Avalanche AVAX expected correctionAvalanche AVAX USD expected correction on base of Fibonacci retracement levels

QI waiting for Retest, then MOOOOOOOOOOOOOOOOONQI flying to Moon might not be possible
But it is necessary.

AVAX to $40 In these days when the price of bitcoin is falling downhill, AWAX has grown miraculously.
It will be close to $ 40 in the near future, while the final target is $ 200.
Good luck.

🔥 AVAX More Potential Up-Side: Areas To WatchOver the last week or so, AVAX has been on a tremendous run, catching the eye of virtually all crypto investors.
As we speak, AVAX is facing a moment of consolidation and profit-taking. After hitting $50, the price has already declined over 15% in not even half a day.
Assuming BTC will remain bullish in the short-term, I think that AVAX will grow further and make a new all-time-high soon.
As drawn on the chart, the first Fibonacci retracement level lines up perfectly with the three tops from March-May. The area around $40 is the first reversal area.
In case the first reversal area doesn't hold, I'm looking at the second reversal area around the 0.618 retracement level, which is around $30.
Happy trading!

Our AVALANCHE AVAX Chart 📊It's the first time I cover this project and I like the chart to begin with.
The price has just broken over MAJOR resistance (all time trend line- which for mw is the greatest line in the world) and it is now checking it as resistance.
Will it go over? Or will it go lower?
I don't know but whichever direction it will go I will follow!
One Love,
the FXPROFESSOR

Avalanche Surges to Multi Month High, Can Bulls Continue ?-Price has risen nearly 120% this week
-The 50MA has held price up the entire run
-Bulls now have to battle major resistance zone
AVAX was consolidating within an ascending channel over the past 3 weeks before bulls came out & pushed price above the top trend line. Since the trend line break, AVAX has exploded to multi month highs. As BTC has been consolidating the last few days, many alt coins have had a chance to push to new highs that haven’t been seen in many months. As long as BTC stays steady, alt coins will continue to run. BTC & other large cap coins set the stage for a large scale market revival which has occurred since August 1st.
While looking at the ascending channel that price was stuck in the last few weeks, we can see how hard the consolidation was, which is what allowed AVAX to go parabolic. Once bulls managed to breakout of the top trend line, AVAX was set free and spiked almost 80% In 2 days. At the time of writing, price got stopped out at a major resistance zone found at $33.45-$37.24. If bulls regain their strength & break and hold this zone, Avalanche will be in for another spike. We can expect prices to hit the given target of $41.91 & potentially $48.10.
At the time of writing, AVAX is being supported by a major support level found at $29.29. In the case bears assert their dominance & push AVAX below this support, we should expect a -15% fall to the next major support of $24.47. This would be a healthy scenario & nothing out of the normal as AVAX is up nearly 120% over the last week. The 50MA has held prices up ever since the uptrend started , so we can expect this to stay true. As long as price is above the 50MA, Avalanche is in a bullish state to potential hit the next given targets.
While looking at the Stochastic RSI, we can see how it has been respecting a trend line over the last few days. If strength fails to hold this trend & breaks below, we should expect similar retracement to occur on the price as it would lose much strength in its current position. The regular RSI also looks very similar as a trend line has supported it the entire ride into the overbought territory. Any break below this trend will break the uptrend & will result in price to fall to the major supports given.
AVAX Intraday Analysis
Spot rate: $29.89
Trend: Bullish
Volatility: High
Support: $29.29
Resistance: $33.45

avaxThe first target was touched (51% profit)
The appropriate shopping area is displayed in a yellow box
Use market pullback
Good luck

AVAX BROKE OUT OF TRIANGLE: Next Stop: MOOOONNext resistances are shown in the Chart. Keep in mind that the AVAX price today is the same as Bitcoin at year 2011.
Happy HODL

AVAX pumping to the MOOOOOOOOOOOOOOOOOONPUMP IT UPP
AVAX BULLISH SOON SUBNETS SOON LAMBO
20USD Resistence broken LETS GOOOOOOOO

%2000 gain to $190 with the flag patternresistances in the way of $190:
R1=$19-$20
R2=$30
R3=$40
R4=$49
R5=$75
R6=$130

Avax There does not seem to be a problem in overcoming the specified resistance, we will reach short-term target 🎯 soon

🆓Avalanche (AVAX) Aug-8 #AVAX $AVAXAVAX has conquered the strong resistance at $14 with very strong buying, so this August AVAX can continue its uptrend towards $18 and $22. But if it loses the $14 zone it will fall back to the $12 or even $10 zone
📈BUY
🔴Buy : 14.7-15.3$
🔴Buy : 13.7-14.3$. SL if B
📉SELL
🔴Sell : 17.6-18.4$. SL if A
🔴Sell : 21.5-22.5$. SL if A
♻️BACK-UP
🔵Sell : 13.7-14.3$ if B. SL if A
🔵Buy : 11.7-12.3$ if A. SL if B
🔵Buy : 9.75-10.25$. SL if B
❓Details
🕯Timeframe : 1 Day
📈Red Arrow : Main Direction as BUY and SELL section
📉Blue Arrow : Back-Up Direction as BACK-UP section
🟩Green zone : Support zone as BUY section
🟥Red zone : Resistance zone as SELL section
🅰️A : The Close price of candlestick is Above the zone
🅱️B : The Close price of candlestick is Below the zone

AVAXAVAX
Everything is ready.. just waiting for it to explode..
good luck everyone.
Tp1 17
Tp2 18
Tp3 44

Akita first needs a breakout of $0.00000185 and then a pullback from $0.00000051 to $0.00000185 there is a %250 gain. you could trade in this zone and take profit at $0.00000185 and wait for the breakout and pullback to buy.

Neutral on AVAXWe need to break some important resistance levels in order to resume the uptrend. It is a nice looking chart, because price respects Fibonacci levels. Also the RSI turned into bullish, but this is not enough as we always wait for a price confirmation before we enter in the trade. The 13-14usd will be an important level to watch in the near future. If we break above, we could enter into the trade.


AVAXUSDAVAX is currently bearish, however, it has been consolidating for 118 days and seems to have found support.
Steps to take:
1) Buy at $13.50 support area OR candle open/close above $18.00 resistance line OR multiple buy signals
2) Sell if candle open/close below $13.50 support


Trading idea for AVAXUSDTIF AVAX continues its reversal movement, it may reach its previous resistance levels soon.

Can AVAXBTC cause an Avalanche with 90% gains?Many large caps have pumped while this Avalanche AVAX remained asleep. This $4.5B market cap has been consolidating since Mar 2021 and remained flirting with the 50D & 100D EMA that became closely paralleled.
My entry level is marked in blue and the almost 90% gains target marked in green. The only thing remaining is the Avalanche to move.
What do you think? And what is your exit target for this gem?
