AVAX 2024- Fast Update.
- Everything in Graphic.
- Buy Breakout 50$++. ( always wait Weekly candle on Monday to have confirmation ).
or
- Buy Retracement : 18$ ish ( 25% invest ).
- Buy Bottom : 10$ ish ( 75% invest ).
- TP1 : 150$ ish( old ATH )
- TP2 : before 380 to 500$ ish ( Just don't be greedy ).
Play S4fe
Happy Tr4Ding !
Avalanche

Why Avalanche Might Not Hit Its All-Time High During The Next BuI saw a couple of posts lately on social media that predicted 200, 300, or even 500 as a price target for during the next bull run.
This surprised me. I don't think that AVAX will get even close to those numbers.
To make this very clear, my assumption has nothing to do with the project in general or Avalanche's technology. On the contrary, I am a big fan of Avalanche and think it will be one of the few projects that will exist ten years from now.
I think AVAX won't hit its previous ATH during the next bull run for a simple reason: Circulating Supply!
AVAX marked its ATH in November 2021, when the price peaked at ~145 USD. Based on the circulating supply at that time (~230m), the asset had a market cap of ~33b.
Since 2021, the circulating supply of AVAX has constantly increased. Moreover, it will continue to increase until it reaches its total supply 443m.
Currently, AVAX has a circulating supply of almost 400m. As a result, to reach the ATH price again, AVAX requires a market cap of 58b. That's almost twice the size of its previous ATH market cap.
Although it isn't completely unrealistic, I consider it unlikely that Avalanche will double its market cap compared to the last bull run. But even if I am wrong with this assumption, the numbers show how unlikely prices of 200, 300, or even 500 are.
Just to do the math: A token price of $500 would lead to a market cap of 200b.
Nevertheless, I still think AVAX has a bright feature and solid potential during the next bull run. At the same time, I consider it essential to have realistic targets.

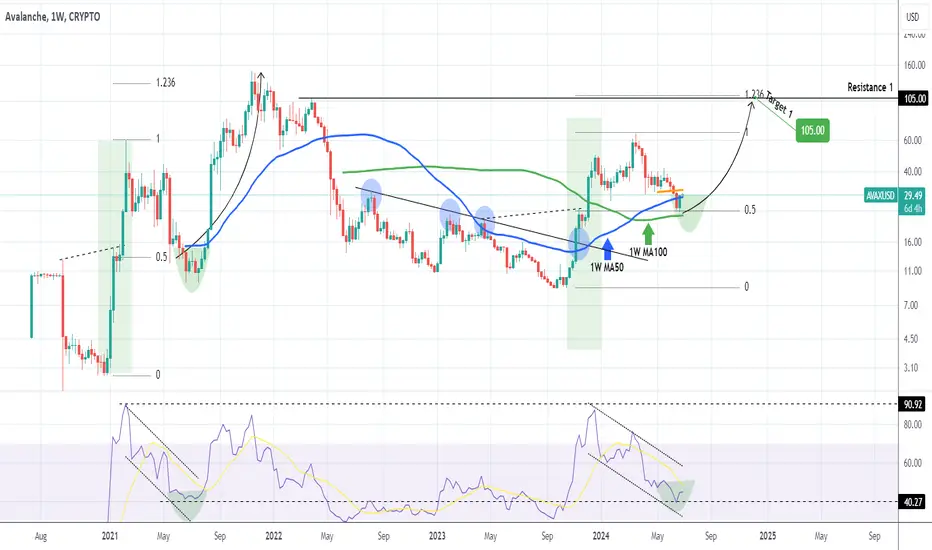
AVAXUSD Bottom formation in process. Target $105.007 months ago we published the following analysis (December 14 2023, see chart below), expecting Avalanche (AVAXUSD), to correct back to the 1.0 Fibonacci level after a potential $55.00 hit:
As you can see the price action didn't fail to deliver our projection, in fact it followed very tightly the February - July 2021 pre-rally pattern of the previous Bull Cycle. Right now it has found Support on the 1W MA100 (green trend-line), while the 1W RSI is on the exact Support level it was on the June 21 2021 bottom.
Even though a marginal decline is possible to satisfy the past condition of slightly breaking below the 0.5 Fib, the current levels are good enough to buy again for the long-term.
As in November 2021, our Target is again the 1.236 Fibonacci extension, which is currently just above the $105.00 Resistance.
-------------------------------------------------------------------------------
** Please LIKE 👍, FOLLOW ✅, SHARE 🙌 and COMMENT ✍ if you enjoy this idea! Also share your ideas and charts in the comments section below! This is best way to keep it relevant, support us, keep the content here free and allow the idea to reach as many people as possible. **
-------------------------------------------------------------------------------
💸💸💸💸💸💸
👇 👇 👇 👇 👇 👇
Avalanche (AVAX) Rises: Can It Break Thru $30?Avalanche (AVAX), a prominent smart contracts platform, is currently experiencing a surge in price. As of July 1, 2024, AVAX is trading confidently above the $28.65 resistance level, hinting at a potential breakout. This article delves into the recent AVAX price rally, explores the technical analysis behind it, and examines whether AVAX can conquer the critical $30 resistance zone.
A Bullish Breeze for AVAX
The ongoing AVAX price rally offers a sigh of relief for investors after a period of price stability. The current movement signifies positive momentum, with AVAX climbing steadily from its $27.40 support level. This upward trend is further bolstered by the fact that AVAX is currently trading above both the $28.65 resistance level and the 100-hourly simple moving average (SMA).
Technical Indicators Paint a Breakout Picture
Technical analysis is a valuable tool for understanding price movements and predicting future trends. In the case of AVAX, a crucial technical indicator is the recent break above the declining channel with resistance at $28.40 on the hourly chart. This breakout suggests a shift in momentum, potentially paving the way for a further price increase.
The $30 Hurdle: A Crucial Test
While the current trend is undoubtedly positive, a significant hurdle awaits AVAX at the $30 resistance zone. A decisive break above $30 would be a strong bullish signal, indicating continued upward momentum. If achieved, this breakout could lead to further price appreciation, with potential targets around $32.50 or even $34.00.
Support Levels: A Safety Net
It's crucial to remember that the cryptocurrency market is inherently volatile. Even in a bullish scenario, there's always the possibility of price corrections. For AVAX, the $29.35 and $28.65 levels act as critical support zones. If the price fails to surpass $30, these support levels can prevent a significant decline. Additionally, the 50% Fibonacci retracement level of the upward move from $27.37 to $29.95 provides another layer of support around $28.65. A drop below $28.65 could lead to a slide towards the $28.00 level and the 100 SMA (4 hours). The $27.40 zone would be the next important support to watch in case of a deeper correction.
MACD and RSI: Bullish Whispers
Beyond price action, other technical indicators offer valuable insights. The Moving Average Convergence Divergence (MACD) indicator for AVAX/USD is currently climbing in positive territory. This suggests increasing bullish momentum. Additionally, the Hourly Relative Strength Index (RSI) is hovering above 50, indicating that the market is neither overbought nor oversold. This neutral RSI reading implies that there's still room for the price to rise before a potential correction.
Looking Ahead: A Promising Future for AVAX
The current price rally for AVAX is a positive development, with technical indicators suggesting a potential breakout above the $30 resistance level. If achieved, this breakout could lead to further gains. However, investors should exercise caution and be aware of the crucial support zones at $29.35 and $28.65. Monitoring the MACD and RSI indicators can also provide valuable insights into the ongoing price trend. Overall, the outlook for AVAX appears promising, and a break above $30 would be a significant bullish signal for the cryptocurrency.
Disclaimer: This article is for informational purposes only and should not be considered financial advice. Please consult with a financial professional before making any investment decisions.

AVAXUSDT#AVAX #Avalanche has formed an excellent and sexy chart pattern. It has created an Inverse Head and Shoulders formation. The target is urgently indicated at $35. Let's take our positions accordingly.

Take a step back and just wait for the rebound on $AVAXJuly 2021 we had a similar move in CRYPTOCAP:AVAX
Price is expected to find the support over the year long channel, and then find again the top of channel with possible 1500%

AVAXUSDTAVAX analysis
Daily and weekly time frame
The price is near the daily and weekly demand area and can move up from this range.
For the long term, this currency can be held for higher targets

$SQRCAT is ready for the next move!$SQRCAT is gaining momentum! We've found strong support right now, and the RSI is oversold on the weekly timeframe. It looks like a Cup & Handle formation is about to form. With three months of accumulation, this is an early call.
- Hidden gem with a doxxed team.
- Small market cap and holder base.
- Team is building every day.
NOT FINANCIAL ADVICE

Avalanche: Take a dive!AVAX continued to head toward our turquoise Target Zone (between $29.30 and $17.48). We expect a dive into this range before the low of the turquoise wave 2 is placed. Subsequently, the coin should turn around and rally above the resistance at $49.95. Should this level be broken earlier (33% likely), we will have to locate AVAX in the turquoise wave alt.3.

$AVAX - Ready to make the avalanche 3X RunCRYPTOCAP:AVAX looks primed and well-supported at this point. Likely a runner after this for the next 2 month period. A great spot buy that can convert to leverage if market follows.

Avalanche Buy OpportunitySo far, I have profited 450%, 56% and 223% from Avalanche. I have already shared the profits I made in 2023 in my X report, and my followers have profited with me. I don't have any Avalanche at the moment. I am waiting for this moving average to pick up. If Avalanche falls below the moving average, I will wait for my Dip Finder indicator to turn green to buy. But if it is rejected from the moving average, I will buy and hold it until my indicator lights white. I will update this post again when I buy, so I recommend you to stay tuned.

RUNE: $6.55 | for 2023 Homerun at $120 levelslike SOLANA LUNA and the rest of big ticket items of Silicon Dubai Funds.. this one is in play for float to be taken over and peddel to $100 levels by Q4
in time for QATAR 2022 fifa fever

NUKLAI NAI at the ABSOLUTE BOTTOM - #datanomics and MOREAbstract
Nuklai is one of those projects that when you truly get to understand it, not only you realize it's a hidden gem, but it has the potential to become its own type of Web3 subdivision such as DeFi, NFT, Metaverse, etc. In this case, we're looking at the birth of #Datanomics, or the monetization of user's data using Web3 technology.
Fundamental Reasons why NAI is a good project
Data mining by big corporate such as Google, Meta, and others is the fundamental pillar on which their business models are based. No data, no freemium. So companies such as Google and Meta get user's data for free, in exchange for Google and Meta products and services.
But what if users could monetize their own data as NAIF tokens and get these companies to pay them for their data? Not only is this an idea that can change it all, but it has been tested and it works!
If you go into their X profile , you can find they already tested this model with a BTC Price Prediction Research that got 2858 entries . This means 2858 NAIF (fraction tokens) were minted, and now each token holder is receiving passive income from 3 subscribers for their contribution to this dataset. This is the first time a user's data is tokenized in such a way!
Token fractions (NAIF) from decentralized datasets is only one of the innovations Nuklai is working on. Another important highlight is their Private Data Networks offer for big enterprises will also bring Web3 data usage to the masses, although this is more of a B2B approach.
Web3 users are used to paying money for acquiring tokens. But what if you can share data for tokens that provide passive income instead? Passive income NAIF tokens swapped for Web3 users data will take off when the market realizes its potential, the #datanomics potential.
Technical Reasons why NAI chart is looking promising
There are three main reasons why the NAI chart looks incredible, almost like an absolute bottom:
1. NAI is in a bullish descending channel that just touched the bottom for the third time. Price action is ready to move into an accumulation sideways. The bottom has just hit only some hours ago.
2. You can see NAI is actually at the bottom of a saucer pattern. Its price action resembles that of BTC 2013-2017 and its three phases of the saucer pattern: descending channel, sideways accumulation channel, and bullish ascending channel. NAI is doing the same. It's now just entering the sideways accumulation channel.
3. The bottom of NAI is at 0.118 fib retracement line, where most bottoms for cryptos occur. This happened the same with LINK, BTC, ETH, etc, at some point, showcasing the unique opportunity to get into NAI at the bottom
4. 4h RSI at total oversold levels. Bounce imminent.
And finally, at only 12M marketcap? There is no greater jewel in the crypto space right now.
If NAI does a proper saucer pattern just as the one BTC did, we could see around +13000%, which will make the price go at least to the 13 FIB line, which is exactly at $1 USD per NAI. I think we may see this within the next 12-18 months or so.

AVAX - Big One? Hi, this is my new update for AVAX. As you see we are in a big range over 6 months now and I expect we are going to takeoff in the next couple of weeks.
In the picture above you see Ethereum in 2017 and it seems that we are going to try something similar to what Ethereum did.
Right now we are in the yellow circle and we are backtesting the trendline. If it holds then we are getting ready for 170% upside with the main target 95-100$.
We have still things to settle, like the RSI and the moving averages. The RSI is still bellow the trendline.
We have good support level around 28 -31$ and big resistance around 55-65$.
Good things take time, be patient.

AVAX/USDT upward momentum from descending resistance breakout? 💎 Paradisers! Keep a close watch on #AVAXUSDT as it shows strong indications of a bullish continuation following a breakout from its descending resistance.
💎 Reviewing recent movements, #Avalanche has effectively broken above its descending resistance and is now positioned for a rise starting from the demand level at $36.72. If it can maintain this momentum, we expect a vigorous advance toward higher levels, although some initial resistance might provoke a significant uptick.
💎 It’s crucial to consider that if the price struggles to maintain momentum at the current demand level, it could signal a softening of the bullish scenario. In such an event, we are prepared to capitalize on a bullish rebound from a lower support level at $35.11. The substantial liquidity at this level indicates that CRYPTOCAP:AVAX could mount a strong bullish recovery. Nonetheless, a breach below this demand level could lead to a notable decline in price.
MyCryptoParadise
iFeel the success🌴

AVAX/USDT It looks fake out, is need reclaim for back to upward!💎 Paradisers, #AVAX is indeed a coin worth monitoring closely.
💎 It has experienced a fakeout, indicating uncertainty in the market. This could lead to a potential test of the OB (Order Book) to gather liquidity before attempting to reclaim or break the resistance level for continued upward movement.
💎 However, if AVAX successfully reclaims the price above the resistance without testing the OB first, it may signal strong bullish momentum, potentially leading to a move towards the supply area around the $47 level.
💎 Breaking through the supply area is crucial to confirm a bullish trend reversal, indicating further upward movement for AVAX.
💎 Conversely, if AVAX fails to break through the supply area and experiences a strong rejection, the price may retreat and test the support level around $39.8, which previously acted as resistance.
💎 A concerning scenario would be if AVAX fails to bounce upon reaching the OB area, potentially leading to a breakdown and a move towards the key support level.
💎 In such a case, a bearish invalidation would occur if AVAX breaks below the key support level and the daily candle closes below it, signaling a continuation of the bearish movement with potential further downward momentum.
MyCryptoParadise
iFeel the success🌴

🔥 AVAX End Of Accumulation, Bulls Rejoice!After a month of trading below the diagonal purple resistance line, AVAX has finally broken out. The break out was accompanied with high volume, further reinforcing the bullish narrative.
My expectation is that there's going to be some kind of altseason in the coming weeks, boosted by Ethereum's ETF optimism.
For now, the signal on chart is my bet.

AVAXUSDT#AVAX CRYPTOCAP:AVAX has created a perfect masterpiece for us. Looking at the chart, a clear triple bottom formation is visible. I expect the scenario to unfold as shown in the chart.

AVAX: The Ultimate Crypto Showdown!Hey traders, get ready for the showdown of the century with AVAX!
In today's thrilling episode, AVAX is gearing up for an epic battle near the critical $33.755 support level. But hold onto your seats, because this isn't your average crypto saga!
As the tension mounts, AVAX faces off against formidable bearish threats, with $43.205 serving as the ultimate prize for the victor!
Will AVAX emerge triumphant, soaring towards $54.345 and beyond? Or will it face defeat, succumbing to a downward spiral towards $28.670 and beyond? The stakes are high, and the drama is real! Tune in to witness the ultimate crypto showdown unfold!

AVAX: pattern📊Analysis by AhmadArz:
🔍Entry: 33.37
🛑Stop Loss: 32.37
🎯Take Profit: 34.47 - 35.49 - 36.59 - 37.75 -38.89
🔗"Uncover new opportunities in the world of cryptocurrencies with AhmadArz.
💡Join us on TradingView and expand your investment knowledge with our five years of experience in financial markets."
🚀Please boost and💬 comment to share your thoughts with us!

AVAX Big Move Alert: Will it Surge to $43 or Plummet to $29?AVAX is lingering around the key daily support zone around $33.76.
Avalanche has to reverse bullish and move towards $43.21.
A break-out of $43.21 will make AVAX bullish in the daily chart and we will see a move to $54.35.
Below $33.76, bears will push price towards $28.67 and, possibly, lower to $22.62.

$AVAX needs a retest before rallying#avalanche #avax price needs correction in mid term, orange boxes are the supports. Short term bounces may become bull traps. NOT FINANCIAL ADVICE.

AVAX Intraday Whirlwind: Catch the Storm of Trade Opportunities!The chart highlights breakout/rejection points, criteria, and targets to execute on the trade opportunity.
Find more in the signature!
