AVAXUSD close to starting a rally to $250.00Avalanche (AVAXUSD) has been trading below the 1D MA50 (blue trend-line) for the past week, ever since the pull-back from the April 02 High. Even though that rattled the confidence of many market participants, there is no cause for concern as this was a short-term profit-taking correction within the larger Rising Wedge pattern on the long-term.
The coin is coming off an Accumulation Phase similar to those of June - July 2021 and October - December 2020. The 1W MA50 (red trend-line) has been supporting for the past 8 months and the 1D LMACD is approaching a Bullish Cross formation. This is a bullish indicator mix, familiar with the previous Rise phases that led to Higher Highs on the Rising Wedge.
The next Higher High is expected to be close to the 1.5 Fibonacci extension. We set a $250.00 long-term target on AVAX.
--------------------------------------------------------------------------------------------------------
** Please support this idea with your likes and comments, it is the best way to keep it relevant and support me. **
--------------------------------------------------------------------------------------------------------
Avalanchesignals

AVAX USDT ANALYSISAvax is performing well as other altcoins do. We broke the bearish TL, and now we can go even higher to $115. Just watch volume and sentiment on other altcoins.

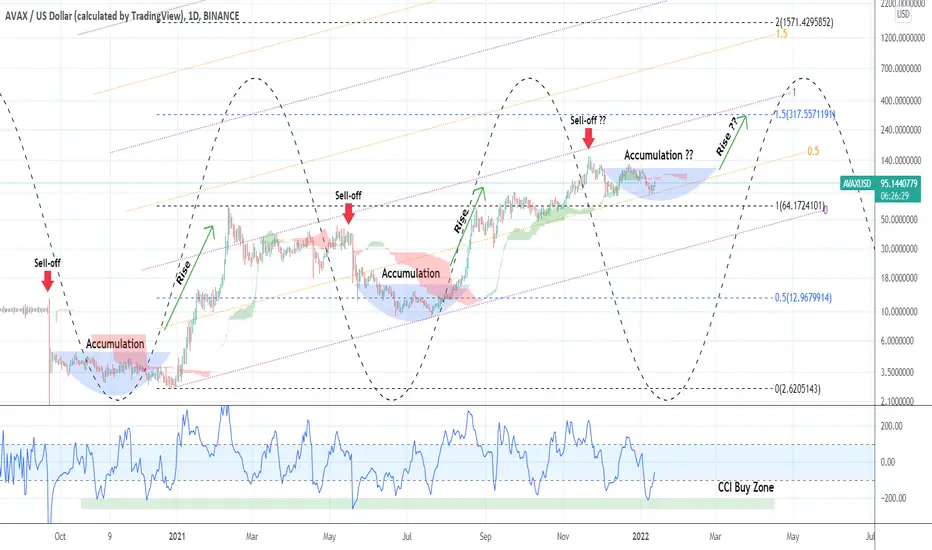
AVAXUSD Cycles with SineWaves. Is it accumulation at the bottom?Avalanche has been one of the surprises of 2021 and despite the market correction since November, it is seen consolidating in rage. I've spotted an interesting cyclical behavior of AVAX, which can provide a fairly accurate pattern to long-term investors.
As you see it is going through phases of accumulation - rise - sell off. There is an underlying Fibonacci Channel that is supporting its long-term uptrend since the September 2020 market bottom.
I've applied the Sine Waves for a better understanding of AVAX's cyclical behavior and as you see it shows that we may be currently half-way through the new Accumulation Phase. The 1D CCI hit last week its long-term Support Zone and has been rebounding since. Such hit and rebound sequences are only seen during AVAX's accumulation phases. Based on that pattern, it is possible to start seeing the new Rise Phase towards the end of February but if you have a long-term investor mind-set, this model shows that Accumulations are done on market bottoms, so the time to buy is now as if the rest of the market rises before, AVAXUSD should follow.
The next target for a Higher High is the 1.5 Fibonacci extension around $315.00.
--------------------------------------------------------------------------------------------------------
** Please support this idea with your likes and comments, it is the best way to keep it relevant and support me. **
--------------------------------------------------------------------------------------------------------
AVAXUSD Buy SignalPattern: Channel Up on the 1D time-frame.
Signal: Buy as the price is A) holding the Higher Lows (bottom) trend-line of the Channel Up, B) holding the 1D MA100 (green trend-line) and C) holding the 6-month CCI Support Zone.
Target: $200 (just below the 1.5 Fibonacci extension and Higher High trend-line of the Channel Up).
--------------------------------------------------------------------------------------------------------
** Please support this idea with your likes and comments, it is the best way to keep it relevant and support me. **
--------------------------------------------------------------------------------------------------------
