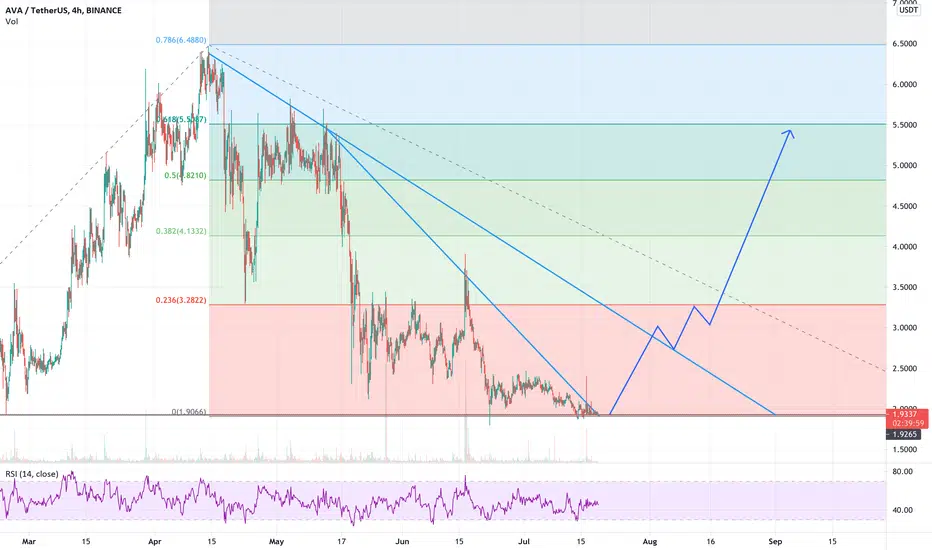
AVA is still sleepinghey traders, there is AVA, we need a close above the blue line for 1D bar to get the green line (short term's targets)
the yellow lines (long term's targets) and the stop loss is a close under the red line for 1D bar
DON'T ENTER BEFORE THE CLOSING!!
.
trade carefully guys and don't forget the risk management.
.
.
.
.
.
.
.
AVAUSDT

AVA/USDT
Hello everyone, if you like This idea, do not forget to support Me with a like and follow Me To receive all that is new
Note: This is a very long trade and I think it will take a long time to achieve the Targets, if you want to analyze it time analysis write in the comments
What do you think about AVA Project future ?
It would be a pleasure to share your opinion with me
Any thoughts 💭💡, questions 🙋♀️🙋♂️❓, good 👍, bad👎, happy 😄 or sad 😥, in the comments always welcome.😄

AVA/USDTAccording to the inverted head and shoulder pattern that I see in this chart, if the trend can be stabilized above the descending triangle, we will have the following goals
TP1:4$
TP2:6$
TP3:8$
TP4:12$
TP5:16$


AVA/USDT { TRAVALA.COM } - BULLISH SETUPANALYSIS 🔎
- AVA/USDT is consolidating in a symmetrical triangle pattern .
- Price is testing the symmetrical triangle's inclined support.
- The market could bounce from this support zone if we have a relatively high buyers concentration.
BUY ENTRY ⬆️
- Aggressive entry: current market price.
- Conservative entry: breakout above the symmetrical triangle's inclined resistance.
TARGETS 🎯
- Symmetrical triangle's inclined resistance.
- Horizontal resistance level (@5.400).
- Horizontal resistance level (@6.468).
- Fibonacci extension level 1.0 (@8.157).
SETUP INVALIDATION ❌
- Breakdown below the symmetrical triangle's inclined support.

You just need to wait a moment ...history repeats itself. I expect the same picture as before. You just need to wait a moment ...


AVA -----> Still in accumulation mode Hello everyone !
Today the Black Cat Trader is analyzing AVA based on a weekly chart.
What we can see :
AVA is still trading under the downtrend line (yellow) and prices are located on the lower line of the pitchfork which is a good support right now. Note that prices are stuck under the EMA21.
What we can expect :
If prices manage to break the downtrend line, we can expect AVA to reach the intermediary lower line of the pitchfork (which would act has a resistance). A pull back on the downtrend line would be perfect to send AVA to upper levels
Major resistance : Downtrend line
Major support : Lower line of the pitchfork
TP1 : 11,74 $ (1.618)
TP2 : 18,03 $ (2.618)
TP3 : 24,33 $ (3.618)
TP4 : 30,62 $ (4.618)
IF YOU LIKE THIS POST, FEEL FREE TO LEAVE A LIKE AND FOLLOW THE BLACK CAT TRADER
MAY THE CRYPTO BE WITH YOU GUYS (D.Y.O.R)

AVA can Pump From local Support.AVAusdt respecting the support multiple time. Low risk entry at support.

AVA-buy zone 2->2.7 target is 3-6 usdtAVA with 4h frame touch BB under, rsi <30, ready to the dip, let buy , DCA and hold to 3-6 usdt,

AVAUSDT Technical Analysis⏳ Spot
💎 AVAUSDT has formed a symmetrical triangle. it has got 2 rejection from the resistance line and after the last rejection it has gone to the pullback zone. it is expected that it starts it's Bullish move from the Pullback zone
🌐 Tradingview
🏁 Short & Medium Term
💵 Invest Only 5% of your Portfolio
🎳 Entry at Market or at 2.800
☕️ TP1 3.500
🍺 TP2 3.800
🍻 TP3 4.300
🍾 TP4 5.600
🍷 TP5 6.500
🍸 TP6 _____
🍹 TP7 _____
🎁 TP8 _____
🚫 SL 2.690
Good Luck 🎲
Check the Links in Description and If you LIKE this analysis, Please support our page and Ideas by hitting the LIKE 👍 button. ❤️ Your Support is really appreciated! ❤️
Traders, if you have your own opinion about it, please write your own in the comment box. We will be glad for this.
Feel free to request any pair/instrument analysis or ask any questions in the comment section below.
We will have more FREE forecasts in TradingView soon
Have a Profitable Day


The best opportunity in AVA Profit 100%AVA/USDT will blow up in the next hours.
Good Luck
Share some coins.


Symmetrical Triangle Breakout - crypto analysis Crypto Analysis: AVAUSDT has broken the symmetrical triangle, it good buy around immediate demand area with below demand area as stop loss for the target given on the chart. let's see
Happy Mining!

AVAUSDT🌟this chart is lower frames shows a H&D formation + a double top touched by chart by none of these are our main goal for entering this one because it has a nice candle respond to the bulls and they are going to be in favor of bulls for now and we can make profit out of it
👉This idea has the confirmation of "advanced price action" 👍
👉Follow us and invite your friends too, this way we can share ideas and signal to anyone we care 👍
👉Hit share and spread the information in public chats or your twitter for everybody to get profit 👍
👉Tell us what's important for you in the market or what asset makes a difference in your investment basket 👍

Hammer with 20/50/100/200 Moving average crossesHammer with 20/50/100/200 Moving average crosses its indicating that AVA might be bounce up targeting 4 soon m we need a daily close above 2.98 for the confirmation

View on AVA/USDT - ready for next up move.View on #AVA/USDT - ready for next up move.
Buy and Add on Dips till 2.25%, sl at $2. Go long for 6$, $9.

AVA/USDTAfter we go above we can buy/long so be ready buy now if you'll long you should have stop lose
🔥🔥

Ava 'travala' to 10 usd perfect buy zone to buy or hold ava
be alert for the next
thanks you for liking and sharing.

AVA (travala.com) bull scenario 19th of July 2021Hi guys,
AVA looks to be very close to the bottom, I'm taking a long around the 1.9 $ area.
Tehnicals : seems to have bottomed out, multiple re-tests on the descending resistance, multiple bull divs on the RSI.
Fundamentals : strong project with actual use case, already being used as an alternative to travel booking by thousands of people, nice cash back options, crypto payments already working, 10% Cashback.
Long from 1.90$, expecting a 3x in the following 60-90 days.
Invalid under 1.75$, probably will buy more if I can get lower price levels.
Not financial advice, DYOR.