Just before turning into an uptrend
Hello, traders.
If you "Follow", you can always get new information quickly.
Please click "Boost" as well.
Have a nice day today.
-------------------------------------
(AVAXUSDT 1M chart)
The key is whether the price can be maintained above 21.39 and rise.
-
(1W chart)
The key is whether it can be supported above 27.29, in the box area of the HA-High indicator (29.24-54.14), and rise above 45.36.
If the price stays above the M-Signal indicator on the 1M chart, there is a possibility that it will turn into an uptrend.
-
(1D chart)
The key is whether it can rise after receiving support around 27.29-28.64.
However, since the StochRSI indicator has entered the overbought zone, we need to look at where it will receive support when it falls from the overbought zone.
If it falls below 27.29,
1st: 24.8
2nd: 21.39
We need to check whether there is support around the 1st and 2nd above.
-
AVAX is just now showing a movement to turn into an uptrend.
Accordingly, the 28.64-31.75 zone can be considered a buy zone.
If you bought in the 28.64-31.75 range, the BW (100) line is the time for a split sell.
If the price rises a little more, the BW (100) line is likely to be created, so the first split trading point may be close.
If the price stays above the BW (100) line or the HA-HIgh indicator, a stepwise uptrend is likely to begin.
-
Have a good time.
Thank you.
--------------------------------------------------
- Big picture
A full-scale uptrend is expected to begin when it rises above 29K.
The section expected to be touched in the next bull market is 81K-95K.
#BTCUSD 12M
1st: 44234.54
2nd: 61383.23
3rd: 89126.41
101875.70-106275.10 (overshooting)
4th: 134018.28
151166.97-157451.83 (overshooting)
5th: 178910.15
These are points where resistance is likely to occur in the future.
We need to check if these points can be broken upward.
We need to check the movement when this section is touched because I think a new trend can be created in the overshooting section.
#BTCUSD 1M
If the major uptrend continues until 2025, it is expected to start forming a pull back pattern after rising to around 57014.33.
1st: 43833.05
2nd: 32992.55
-----------------
Avax

AVAX road to $99AVAX appears to be unfolding in a leading diagonal pattern, with a final push in the minor wave 5 still to come. Afterward, we’ll need to watch for a potential retracement in wave 2 of the minor degree.
Once this correction completes, the price could enter a parabolic phase, with powerful bullish candles driving it upward, potentially reaching the $99 target.

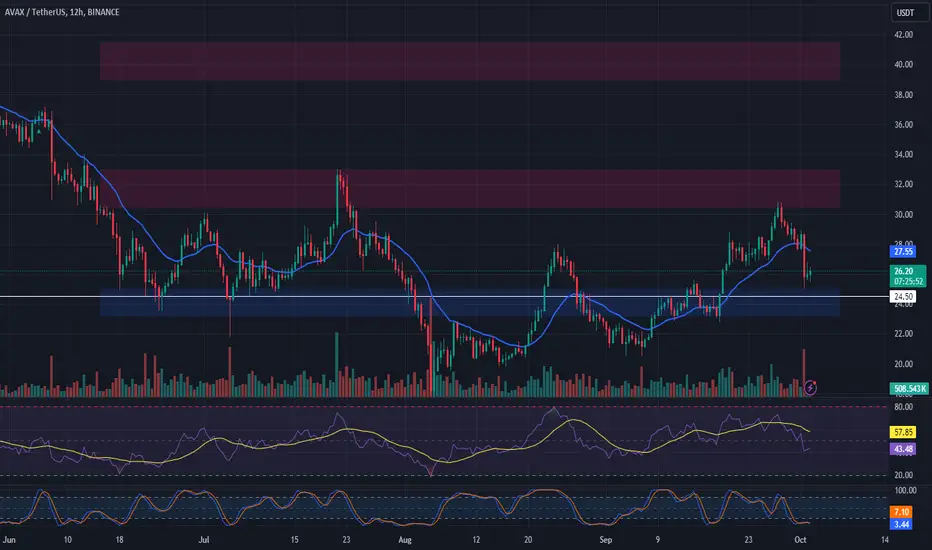
SasanSeifi| Are We Headed for $35/$40 !??Hey there, ✌ BINANCE:AVAXUSDT In the daily timeframe, we've witnessed a persistent downward trend for more than four months. Recently, the price corrected and has now entered a phase of positive volatility around the $20 level. After breaking the downtrend line, it successfully reached the critical $30 threshold, indicating significant growth.
At present, after testing the $30 resistance, the price has retraced and is trading around $26. It's vital to maintain support levels between $25 and $20 for a continued upward trajectory.
Looking forward, if we can hold these support zones and the price stabilizes above the 200 EMA and the $30 level, we could target a move towards $35 and potentially reach the $40 order block.
For a better grasp of future price movements, it’s essential to monitor how the price reacts. Should the price fail to hold above these critical support levels and dips below the demand zone, we may see further corrections down to $15, $13.50, and $10.
This analysis is my personal viewpoint and not financial advice. If you found this helpful, please like and comment – I’d love to hear your thoughts! Happy trading! ✌😊

AVAX Confined to an Elongated Channel: Range-Bound indefinately AVAX appears to be trading within a very elongated channel, which could represent either an impulse wave (up to Wave 4 in this case) or, more likely, a WXZ or WXYXZ corrective structure. The absence of a strong upward lunge or decisive break above the upper green trendline supports the idea that AVAX is stuck in this corrective phase.
Until a clear breakout occurs, the price seems confined to the boundaries of this channel. For those looking for opportunities within this range, you could consider trading the key levels—but be cautious of the lack of a decisive trend change. It’s important to keep in mind that without a strong move outside of the channel, any significant upward momentum may take some time to materialize.

Long AVAXTraders,
Though the indicator is weak having not received full confirmation at the time of this post, I have chosen to go long AVAX once again. AVAX is one of my favorite alts and from the chart we can see that we have several good support underneath us.
First, there is that ascending trendline. Secondly, we have that VRVP PoC. And the third indicator is not seen on this chart. We have many coins flipping green today. Visit my weekly update for more on what I am seeing on a macro scale. I posted this update yesterday.
Again traders, keep in mind I am earlier in entry than I normally feel comfortable with on this trade. I really would like to see a strong cross of the MA on the RSI chart. Thus, entry risk is a bit higher. Trade accordingly.

Four Horseman of Defi !?Defi is dominated by four sectors. Chains. Staking. Dexs. Lending. Those four sectors cover majority of crypto space today. Together they create a liquid financial market. Tomorrow they may help spawn an emerging sector like ai, gaming, metaverse, nft, depin, etc into a dominate industry.
Unfortunately for many those emerging sectors have yet to become dominate day to day within crypto or outside of crypto.
For now we have chains, staking, swapping and lending.
We have four chains that are widely available on centralised exchanges. Ethereum, Solana, Sui and Avalanche.
The four assets listed here cover all four widely available high performing chains in all four high performing sub sectors.
BenQI is the high performing lending protocol on AVAX.
Uniswap is the high performing dex on Ethereum (and defi space as a whole).
Sui is the high performing growth layer 1 chain leading after the big3 (eth, sol and bsc).
Jito is the high performing staking protocol on Solana.

AVAX BULL TO $74It appears that if Bitcoin does not enter a bearish phase, we will experience an altcoin season, presenting optimal long entry opportunities with minimal stop-loss requirements.
Therefore I see AVAX going to $74

Is AVAXUSDT About to Crash? Here's What You Need to Know!Yello, Paradisers! Are you keeping a close eye on AVAXUSDT? We’re seeing bearish signals that could indicate a major move down! 📉
💎Currently, AVAXUSDT is forming a classic Head and Shoulders pattern from a key resistance zone—a strong indication of a potential bearish reversal. 🧐 On top of that, we’ve spotted a Change of Character (CHoCH) confirming a bearish market structure, further tilting the probability to the downside.
💎But that’s not all. If AVAXUSDT pulls back and we see an Internal CHoCH (I-CHoCH) on the lower time frames, it will strengthen the bearish sentiment and signal an entry opportunity. In this scenario, the right shoulder could develop on the higher time frame.
💎Don’t forget, there’s a supportive trendline nearby that could cause some price reactions. Manage your positions carefully and don’t get caught in a false breakdown.
💎However, if the price shows strength, breaks above the resistance zone, and closes a candle above, it will invalidate our bearish outlook. In this case, it’s a clear no-trade zone until we see a decisive break in either direction.
🎖With the markets always throwing surprises, remember: Stay patient and wait for the highest probability setups. Discipline is key to consistent profitability.
MyCryptoParadise
iFeel the success🌴

AVAX Long Spot Position (Support Entry)Market Context: AVAX has retraced to a key support level between $23.00 and $25.50, offering a strategic entry point for a long trade as it shows potential for a bounce.
Trade Setup:
Entry: In the current $23.00 - $25.50 level of support.
Take Profit:
First target: $30.50 - $33.00
Second target: $39.00 - $41.50
Stop Loss: Just below $24.50.
This trade aims to leverage the support level for a potential upward movement, maintaining a favorable risk-reward ratio. #AVAX #SupportTrade
#AVAXUSDT #4h (Bybit) Ascending channel breakdownAvalanche lost 50MA acting as resistance now, seems to be heading towards 200MA support.
⚡️⚡️ #AVAX/USDT ⚡️⚡️
Exchanges: ByBit USDT
Signal Type: Regular (Short)
Leverage: Isolated (7.0X)
Amount: 4.9%
Current Price:
28.095
Entry Targets:
1) 28.435
Take-Profit Targets:
1) 25.140
Stop Targets:
1) 30.085
Published By: @Zblaba
CRYPTOCAP:AVAX BYBIT:AVAXUSDT.P #Avalanche #Web3 avax.network
Risk/Reward= 1:2.0
Expected Profit= +81.1%
Possible Loss= -40.6%
Estimated Gaintime= 1 week

NOCHILL v2 or The Chill is over [MEMECOIN on AVAX]God it's been a while since I've posted here for the last time.
Real life is real. Inner work needs some time (the whole lifespan to be fair).
But you're here probably not to read some stories and the life lessons (If you are - tell me though), so!
Bought several Memecoins on AVAX on 1st Jan and forgot. Forgot so much that missed my 100x.
Well, anyways. It's on the breakout now after falling down and i think we might go at least to TP1 and all the way to 0,5 Fib (If it will go higher, I'll update).
On top of that, the volume seems to break out too:
Not the fin advice, just my thoughts.
Ngl wanted to post this thread when it was around .0044 but still wasn't sure. Now it seems more then real that we're gonna see the next leap.
Thanx!
A_Vision

AVAX IMPULSE WAVE #AVAX #LONGTERM #MONTHLY
"On the monthly timeframe, the coin is bouncing off the main support at $20. I also believe that the monthly candle close will be an engulfing candle.
Main target: $100 to $250.
The $500 target is a major goal that may or may not happen under certain conditions and significant market news."
STOP LOSS : 17$
"The recommended holding period for the coin is 6 to 9 months."

AVAXUSD Bottom formed & going for the ultimate bullish breakout.Avalanche (AVAXUSD) has just touched this week the top of the 6-month Channel Down. In cyclical terms, this is just a big Bull Flag half-way through the Bull Cycle, similar to those of the previous one, in August - November 2020 and March - June 2021.
The Cycle's 2nd bottom is in being doubt as the RSI held and rebounded on the 40.00 Symmetrical Support, which held and kick started the post June 2021 bottom rally. The only confirmation left to give us is to break above the 1W MA50 (blue trend-line) for the first time since late July.
As you can see both of 2020 - 2021 Bull Flags rebounded aggressively reaching the 2.0 Fibonacci extension. As a result once the 1W MA50 breaks, we expect a similar rally on AVAX, whether more aggressive like 2020 or marginally less like 2021, but our Target is at $250.00 (Fib 2.0 and above the All Time High).
-------------------------------------------------------------------------------
** Please LIKE 👍, FOLLOW ✅, SHARE 🙌 and COMMENT ✍ if you enjoy this idea! Also share your ideas and charts in the comments section below! This is best way to keep it relevant, support us, keep the content here free and allow the idea to reach as many people as possible. **
-------------------------------------------------------------------------------
💸💸💸💸💸💸
👇 👇 👇 👇 👇 👇

Avalanche: Knock, Knock...AVAX was able to gain further ground within our turquoise Zone (between $17.48 and $29.30) and is currently trying to break through the resistance at $28. As soon as the coin manages to establish itself above this level, this should provide further upward momentum. We then expect the remaining sub-waves of the blue wave (iii) to produce a decisive increase. Consequently, long positions can still be opened within our Zone, with stops placed around 1% below its lower edge or at the support level of $17.44. Should the price slip below the $17.44 level (33% likely), we will still have to locate it in the turquoise-colored wave alt.2.

[AVAXUSDT] - bullish patternAvax coin is one of the most important coins in layer1, layer2 tokens
Now it's so close from weekly close ... it's bullish incase of breakout.
The lowest target is at march top (63$)
Best regards cecilion🎯

AVAX scalp in H1📊 Analysis by AhmadArz:
🔍 Entry: Wait for a bullish confirmation around $26.80.
🛑 Stop Loss: Below $26.45.
🎯 Take Profit:
- TP1: $27.46 (Close 50% position)
- TP2: $28
- TP2: $28.88
- Re-entry: Consider around $25.00 for another position.
---
🔗 "Uncover new opportunities in the world of cryptocurrencies with AhmadArz.
💡 Join us on TradingView and expand your investment knowledge with our five years of experience in financial markets."
🚀 Please boost and 💬 comment to share your thoughts with us!

AVAX update ; alpha formation AVAX update ; alpha formation
the big bulls option. packing.
i like the way avax moves once it gets going. perfect to dump on one of its vertical spam pumped runs.
this could def be a trap. but im long and strong.
hold me

Alikze »» ALGO | Ascending corner pattern🔍 Technical analysis: Ascending corner pattern
- It is moving in a downward channel in the daily time frame.
- It was mentioned in the analysis presented in the previous post, after the failure of the supply zone, it will have the ability to continue the trend until the next supply zone. But it faced selling pressure in the first supply area, which led to a correction of 0.23 from the previous wave.
-Currently, it is in a corner pattern, which after the break of the channel, a pullback to the roof of the descending channel has been done.
- Also, with the support of dynamic trigger, it can lead to escape from density.
- Therefore, by leaving the density, it will have the ability to reach the specified goals and also the supply area.
💎 Alternative scenario: In addition, if it faces selling pressure in the area of the high dynamic trigger and does not have a correction in the form of a soft landing, it can continue to correct up to the range of 0.097 with the failure of the low dynamic trigger.
💎 Note: If Fibo 0.23 is not maintained and below the stabilization zone, the bullish scenario will be invalidated and should be reviewed and updated.
»»»«««»»»«««»»»«««
Please support this idea with a LIKE and COMMENT if you find it useful and Click "Follow" on our profile if you'd like these trade ideas delivered straight to your email in the future.
Thanks for your continued support.
Best Regards,❤️
Alikze.
»»»«««»»»«««»»»«««
BINANCE:ALGOUSDT

#AVAX/USDT#AVAX
The price is moving in a descending channel on the 4-hour frame and is sticking to it very well and is expected to break it upwards
We have a bounce from a major support area at the lower line of the channel at a price of 23
We have a downtrend on the RSI indicator which supports the rise
We have a trend to stabilize above the moving average 100
Entry price 23.69
First target 24.81
Second target 25.70
Third target 26.86

28 and 33 waiting for reclaim #avaxWithin increasing momentum and score avax is about to to test resistance levels.
Let's see if scorehood ai based analysis will be proven right again?

AVAX : Potential Reversal in MACRO TFA downtrend, or bearish trend is characterized by a few things including making lower lows and lower highs. This is evidently seen when pulling up the macro timeframe and applying trendlines towards major bounce zones or wicks.
Similarly, an uptrend is characterized by the price making higher lows, and higher highs. Currently, we are only seeing ONE of these conditions met - the higher lows. This does not mean the price cannot retrace towards the trendline. However, as soon as the trendline is lost, the higher lows is invalidated and the price remains BEARISH.
A fall UNDER the trendline would likely lead to a revisit of a wick at $17.
While you're here👀 Make sure you check out yesterday's post on 3 Alt that are bearish right now:
___________________________________
BINANCE:AVAXUSDT.P

AVAX Long Position (Potential Bounce in Conviction ZoneMarket Context: AVAX is still in a downtrend but has retraced over 60% from its previous high and is trading in a strong conviction zone. The price is setting higher lows and has reclaimed the 21-day EMA, signaling buyer strength.
Trade Setup:
Entry: Long spot position around $23.
Take Profit:
First target: $29 - $32
Second target: $40 - $44
Stop Loss: Daily close under $20.

AVAX Bearish TrendPrice is touched by Custom FVG zone, But you have to act smartly because every deal is not easy to get and most of the time a trap is prepared for you so that your pocket is empty before entering the main process and only regret is left in your heart.
