📈🔍 AVAX Long Trade Analysis 🔄💼Trade Overview:
AVAX is potentially poised to break out of a level of resistance, offering an opportunity for a long spot trade.
Trade Setup:
Entry: Enter into a long spot trade at the break of the top of the range area of support of $35.75.
Take Profit: Target profit levels at $40.50 - $45.00 and the next resistance area at $50.00 - $53.00.
Stop Loss: Set the stop loss just below $34.00 to manage risk effectively.
📊🛡️ Exercise caution and closely monitor AVAX's price movement for trade management! #AVAXTrading #CryptoAnalysis 📉🚀
Avax

AVAX Intraday Whirlwind: Catch the Storm of Trade Opportunities!The chart highlights breakout/rejection points, criteria, and targets to execute on the trade opportunity.
Find more in the signature!

AVAX Bullish W PatternCRYPTOCAP:AVAX W pattern is in making in 1Dtf and you know what will happen when W pattern breaks out🚀
CRYPTOCAP:AVAX is the next Big Thing💵
I'm in Long from: 36.40
Minimum Targets 40.00 - 44.00 - 47.00
Sl: 30.00
#dyor #nfa #aqeelonline

Avalanche AVAX Intraday Trade SetupThe chart highlights breakout/rejection points, criteria, and targets to execute on the trade opportunity.

AVAX USDTAVAX Setup. After a confirmed breakout from the marked zone in green, we could take an entry at 36.51. Remember stop loss is your friend. Everything is on the chart.
Entry 36.51
S.L 35.49
T.P 1 37.85
T.P 2 39.48

Avax long, looking strongAvax looking good!
Break of daily trend and a retest of the break could be a nice entry.
We also have support (and could see bounce) from 20 and 200 Moving average.
Avax is in a good position to starting a new wave.
With some help from BTC, this could be a killer entry.
Non financial advice - but for me, DCA or trade are both good options.

AVAX: sell in high level of reng📊Analysis by AhmadArz:
🔍Entry: 38.86
🛑Stop Loss: 42.68
🎯Take Profit: 36 -32.91 -30.35
🔗"Uncover new opportunities in the world of cryptocurrencies with AhmadArz.
💡Join us on TradingView and expand your investment knowledge with our five years of experience in financial markets."
🚀Please boost and💬 comment to share your thoughts with us!

Avalanche in 2024: Boom or Bust? Examining Analyst Predictions The cryptocurrency space is a whirlwind of predictions, with influencers and analysts vying for attention with bold claims about the future of various digital assets. One such case is Crypto Archie, a popular Twitter personality who recently made a bullish prediction for Avalanche (AVAX), a gaming-centric cryptocurrency. With AVAX experiencing a significant rise this year, the question remains: is Avalanche poised for an "explosion" in 2024?
Avalanche's 2024 Trajectory: A Look at the Numbers
Crypto Archie's prediction certainly piques investor interest. Avalanche has indeed made impressive strides in 2024, boasting a 158% year-to-date (YTD). This growth is a testament to the increasing adoption and potential of the Avalanche ecosystem.
However, recent price fluctuations paint a slightly different picture. Trading around $35 at the time of writing, Avalanche seems to be experiencing a period of uncertainty. The Relative Strength Index (RSI), a technical indicator used to gauge market momentum, currently sits around 52. This suggests a balanced market, with no clear indication of overselling or overbuying. This neutrality could be interpreted as a sign of consolidation before a potential breakout, but it also reflects investor hesitation.
Technical Support and Resistance: A Range-Bound AVAX?
Currently, Avalanche seems to be tethered between $30 and $34. This relatively narrow range indicates potential price fluctuations within these boundaries in the near future. While this might not align with Crypto Archie's vision of an "explosion," it doesn't necessarily negate the possibility of future growth.
Beyond Predictions: The Strength of Avalanche's Technology
While analyst predictions and price movements are important factors, they shouldn't be the sole basis for investment decisions. A crucial element to consider is the underlying technology powering the cryptocurrency. Avalanche boasts a unique architecture designed for scalability and speed, addressing some of the limitations plaguing older blockchains like Ethereum.
Avalanche's platform allows for the creation of subnets, essentially customized blockchains for specific applications. This caters particularly to the gaming industry, where fast transaction speeds and scalability are paramount. Additionally, Avalanche's security relies on a Proof-of-Stake (PoS) consensus mechanism, which is considered more energy-efficient compared to Proof-of-Work (PoW) used by Bitcoin.
These technological advantages position Avalanche as a strong contender in the burgeoning blockchain-powered gaming space. Increased adoption from game developers and players could fuel future price growth for AVAX.
Investing in Avalanche: A Calculated Approach
While Crypto Archie's prediction injects optimism, it's essential to approach cryptocurrency investments with a healthy dose of skepticism. The market is inherently volatile, and unforeseen events can significantly impact prices.
Conducting thorough research beyond analyst predictions is crucial. Understanding the technology behind Avalanche, the competitive landscape, and the overall market trends is essential. Additionally, investors should consider their risk tolerance and develop a well-defined investment strategy before committing any capital.
Avalanche in 2024: A Promising Future Built on Technology
Whether Avalanche experiences an "explosion" in 2024 remains to be seen. However, its robust technology, focus on the booming gaming sector, and existing community support create a compelling case for its long-term potential. While short-term price movements may be uncertain, Avalanche's fundamentals offer a solid foundation for future growth.
For investors, careful research, understanding individual risk tolerance, and building a balanced portfolio remain key to navigating the ever-evolving cryptocurrency landscape.


📈Technical Analysis: AVAX for Potential Trading Opportunities🚀📈 Comprehensive Analysis of AVAX: Daily Market Insights 📈
☀️In today's analysis, we embark on a journey into the intricacies of Avalanche (AVAX) trading, exploring potential avenues for profit amid evolving market conditions. As we delve deeper into the dynamics of AVAX, we uncover compelling insights that could shape your trading decisions.
🔍Zooming into the 4-hour timeframe, AVAX witnessed a noteworthy retracement following its ascent to the $63.78 mark, experiencing a 50% pullback. However, the retracement lacked significant bearish momentum, hinting at underlying strength within the market. This suggests the potential for a bullish continuation, with a promising trigger emerging on the horizon.
📉Amid recent market volatility, AVAX found reliable support around the $33.13 level, followed by a rebound and subsequent retracement to the 0.382 Fibonacci level. Despite minor fluctuations, the prevailing sentiment leans towards optimism, as sellers struggle to exert sustained downward pressure. This sets the stage for potential long positions, contingent upon buyer confirmation.
📊While current volume levels remain subdued, reflecting typical weekend trading patterns, there's a modest uptick compared to previous sessions. However, volume alone fails to decisively affirm the direction of the trend. Meanwhile, RSI presents a noteworthy signal around the 65.43 mark, indicating the potential for overextension and signaling bullish momentum if surpassed.
💡For traders eyeing short-term opportunities, consider a long entry upon breaching the $39.28 threshold, coinciding with the 0.5 Fibonacci level and offering confirmation of bullish momentum. Patience is key as volume dynamics unfold, potentially affirming buyer conviction. Additionally, monitor for a potential short entry below $33.13, particularly as the SMA99 converges with candlesticks, hinting at potential bearish momentum.
📝As we navigate the complexities of the AVAX market, it's imperative to remain vigilant, adapting your strategy in response to evolving market dynamics. The current landscape presents an array of opportunities for astute traders to capitalize on potential price movements. Stay tuned for ongoing updates and insights as we continue to dissect the intricacies of AVAX trading.
🧠💼It's important to acknowledge the inherent risks in futures trading, with the potential for margin calls if risk management is neglected. Always adhere to strict capital management principles and utilize stop-loss orders, ensuring that the initial target offers a risk-to-reward ratio of 2


AVAX, the flattening? Elliott waveIf you find this information inspiring/helpful, please consider a boost and follow! Any questions or comments, please leave a comment!
Same levels on watch since last update,
when it pivoted at AOI. 🧵
I see a 3 wave move up, but honestly,
doesn't matter.
Many variations would benefit from at least one more low.
$38 break and flip needed.
$26-$22 AOI if lower atm.

AVAX-USDT | 4H | TECHNICAL CHARTHello traders, AVAX has completed its first 5 waves, and now it's time for the completion of the ABC wave. Right after the completion of wave C, I combined harmonic patterns and made an analysis of both. I marked my target with yellow arrows on the chart after the completion of the harmonic pattern.
If you want me to keep my analysis up to date, please don't forget to like this post.
Thank you for considering my analysis and perspective.

🏔️💰 AVAX Long Trade Opportunity! 🚀📈📊 Analysis:
Support Retracement: AVAX is currently at the $32.00 - $35.00 support level.
Entry Point: Consider entering a long spot trade within this support range.
Profit Targets: Aim for $40.00 - $45.00 or $50.00 - $53.00 resistance levels.
Risk Management: Set a tight stop-loss just below $32.00.
📈 Trading Strategy:
Entry: Long trade initiated within the $32.00 - $35.00 support range.
Targets: Take profits at identified resistance levels.
Risk Control: Maintain discipline with the stop-loss.
🚨 Note: Monitor the market closely for any changes in price action! 📊🔍 #AVAX #LongTrade #CryptoAnalysis 🎯💱

BTCUSDT | 4H | TECHNICAL CHART Hello traders, If buying doesn't come in at the 65,000 level for Bitcoin, it will drop down to the 62,000 level.
I have determined the formation target on the chart. I wish everyone success.
Like and comment if you find value in our analysis.
Feel free to post your ideas and questions at the comments section.
Good luck

LandWolf on @Avax Wolf $wolf #Wolf $Landwolf #LandWolfI gave you this over the weekend and told you to be sure to not missuit on EASY$.
Just from Friday until Monday you got an easy and quick 50-60% return. Even if late to the call and didn't get the best of entries or perfect exit, you should have easily grabbed 20-30% on this one.
If you ever wanted to follow early to accounts that stay in the game and up with what's going on and wish you made a appearance with them prior to them being bigger followings etc. this is a great opportunity lol with me, my larger OG account I've spent the last several years and all through the bear building was killed by X and now I'm starting over from scratch.
I've purposely given you the same chart and layout but on two different time frames to help newer traders coming into this cycle see how different things can look on a daily vs a weekly time frame.
I think that this can really help speed up learning for many and to open their minds to variables.
As you see the daily can easily in this case look much more instantly bullish and give you the greater feeling of FOMO #Fomo to jump in. Whereas the weekly can give you more of a tactical view and help with your approach being so.
Hopefully some of you find this chart helpful during this stressful pullback/flush that I'm aware has really beaten down and or killed many portfolios for traders.
I've fallen off on posting/sharing my charts these last few months while I was trading ALOT myself and on multiple platforms and various ideas. However, during these more stressful times I will try and stay more active with updating what community I have.
For my birthday without cause or warning X shutdown my larger account @RareBreedOG so I'm starting over fresh with almost no followers now for the algorithm. That being said I would greatly appreciate help with you hitting the like /Follow/share buttons as much as possible if you find these charts helpful at all or even just want to help me rebuild my following after getting Fu**ed by X. For this reason, I don't plan to pay for a checkmark this time around either, but you can all help give me reason to keep sharing and not just leave to other platforms.
Everyone stay safe and trade wisely and be careful with leverage in these uncertain times.

$Wolf #LandWolf on $AvaxDon't be fooled by incorrect contracts and many fake versions of this.
The true wolf on CRYPTOCAP:AVAX can be traded on @mexc and many other places but do your due diligence and make sure you're not buying some fake version as there are many.
This is part of the #BoysClub much like $Andy CRYPTOCAP:PEPE $Brett
The true NYSE:WOLF is on the red chain on @Avax
I think it will be an easy 3-5x for semi confident and decent traders. I think IMO it will be an easy 10x+ for more skilled traders and traders with greater conviction in their plays and the cycles and how they work.
IMO we are back into great DCA areas and even decent entries for those that like to buy and walk away i.e. set it and forget it.
I've sold and bought on these lines/ranges given MANY times this cycle and made great profits each time.
besides liking the overall ticker, lol i think it's one of the better priced mkt. values still of quality (if you want to call any meme such) coins left in the markets that are established.
I myself continue to make this play and have had great success with it this cycle.
Hopefully this chart is of some use to someone out there looking for info on this ticker.
Only you can decide which coins you trade as well as which chains they are on. You'll also find versions of most coins on CRYPTOCAP:SOL NASDAQ:BASE CRYPTOCAP:ETH etc.
CRYPTOCAP:PEPE also exists on many other chains and under many various contracts. Some do well, some do phenomenal, some don't do much at all besides make you exit liquidity.
I like my NYSE:WOLF on CRYPTOCAP:AVAX and trade it on Mexc which has worked for ME.
I didn't run this exact one on multi time frames in same post if someone wants, they can request and I'm happy to repost it.
I've purposely given you the same chart and layout but on two different time frames to help newer traders coming into this cycle see how different things can look on a daily vs a weekly time frame.
I think that this can really help speed up learning for many and to open their minds to variables.
As you see the daily can easily in this case look much more instantly bullish and give you the greater feeling of FOMO #Fomo to jump in. Whereas the weekly can give you more of a tactical view and help with your approach being so.
Hopefully some of you find this chart helpful during this stressful pullback/flush that I'm aware has really beaten down and or killed many portfolios for traders.
I've fallen off on posting/sharing my charts these last few months while I was trading ALOT myself and on multiple platforms and various ideas. However, during these more stressful times I will try and stay more active with updating what community I have.
For my birthday without cause or warning X shutdown my larger account @RareBreedOG so I'm starting over fresh with almost no followers now for the algorithm. That being said I would greatly appreciate help with you hitting the like /Follow/share buttons as much as possible if you find these charts helpful at all or even just want to help me rebuild my following after getting Fu**ed by X. For this reason, I don't plan to pay for a checkmark this time around either, but you can all help give me reason to keep sharing and not just leave to other platforms.
Everyone stay safe and trade wisely and be careful with leverage in these uncertain times.

AVAX - SHAKEOUT before FINAL ATH📉Hi Traders, Investors and Speculators of Charts📈
AVAXUSDT, an ETH rival, is another altcoin currently trading lower than it's first ATH. This is important, because it makes for an excellent low risk and high reward trade.
Currently, we see the markets trading in a corrective phase where wicky price action and shakeouts are common.
I've been bullish on AVAX for a very long time, and we've seen great increases since my last update:
If you found this content helpful, please remember to hit like and subscribe and never miss a moment in the markets.
_______________________
📢Follow us here on TradingView for daily updates📢
👍Hit like & Follow 👍
CryptoCheck
BINANCE:AVAXUSDT

AVAX Long Term Bullish - (April, Technical Analysis)Avalanche (AVAX/USD) If in doubt, zoom out! Despite the recent crash on most coins, some have experienced a larger fall. However, AVAX is still forming: "Higher High's & Higher Low's" on the trend line pattern from the chart. Is this recent dump before the BTC halving a shakeout so that whales can accumulate even more??
AVAX held support from the recent crash touched perfectly on the 50% fib retracement at: "$35" and bounced off. A retest to $65 price in the future is very likely soon as Avalanche is still looking bullish long term for 2024.
Line of Support= $35🟢
Minor Resistance= $45🔴
Major Resistance= $65❌
Target!= $75🌟
‼️DISCLAIMER PLEASE READ CAREFULLY‼️
*(THIS NOT FINANCIAL ADVICE, ALWAYS DO YOUR OWN RESEARCH! I AM NOT RESPONSIBLE FOR ANY LOSS OF EARNINGS FROM ANY INVESTMENTS THAT YOU MAY MAKE BASED OFF ANY OF MY IDEAS. ONLY INVEST WHAT YOU CAN RISK TO AFFORD TO LOSE IF YOU MAKE THE DECISION TO DO SO. DO NOT INVEST, UNLESS YOU'RE PREPARED TO LOSE MONEY, IF NOT ALL.)
(CRYPTOCURRENCY CAN BE HIGH-RISK INVESTMENTS DUE TO THE VOLATILLITY OF IT'S NATURE, AND YOU SHOULD NOT EXPECT TO BE PROTECTED IF SOMETHING GOES IN THE WRONG DIRECTION. SEEK PROFESSIONAL ADVICE FROM A CERTIFIED FINANCIAL ADVISOR.)

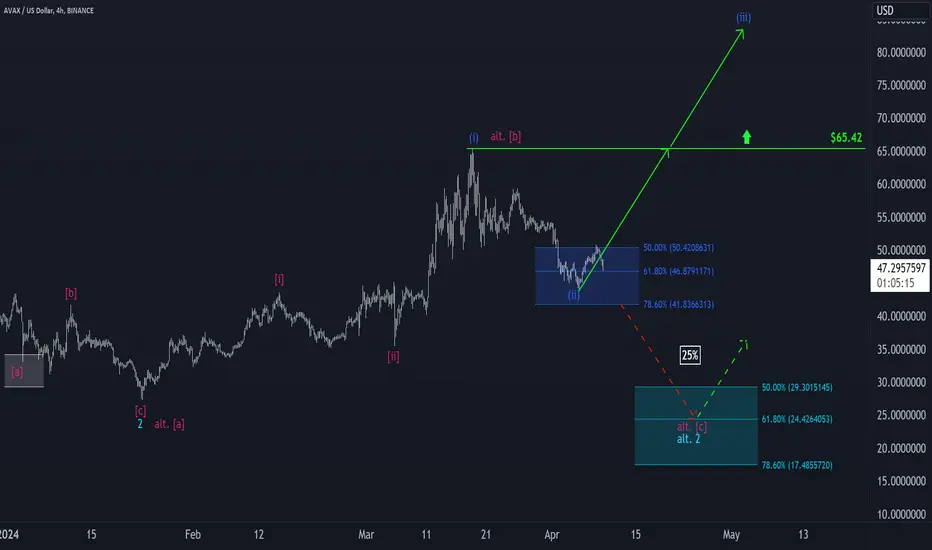
Avalanche: Take-off 🛫AVAX turned within our blue Target Zone ($41.83 – $50.42). Accordingly, we consider the low of the blue wave (ii) to be established. In the further course, the same-colored wave (iii) should continue well above the resistance at $65.42. Investors can open long positions in our Target Zone. Stops could be placed around 1% below the Zone. Indeed, if the price slips below the lower edge, this will activate our alternative scenario (25%). In this case, the price should drop to our turquoise Target Zone (between $29.30 and $17.48) to place the low of the turquoise wave alt.2.
AAVE, the next AVAX? 115% upside potentialAAVE / Weekly
- It's a weekly candle chart
- IF we close above $113 this week, a rebound is very probable
- There is the recent resistance line of $150, but high probability that we smash it through and go at least to $240

Avalanche (AVAX) - Upside Breakout (April, 2024)Avalanche (AVAX) - has formed a bullish wedge pattern on the 4-hour timeframe, breakout to the upside past Resistance from a downtrend since: mid March 2024.
If a rally from the break pushes further forward to: "$65", then past it.. momentum will continue and AVAX could head higher at prices of: $70 once key level Resistance has been reclaimed.
‼️DISCLAIMER PLEASE READ CAREFULLY‼️
*(THIS NOT FINANCIAL ADVICE, ALWAYS DO YOUR OWN RESEARCH! I AM NOT RESPONSIBLE FOR ANY LOSS OF EARNINGS FROM ANY INVESTMENTS THAT YOU MAY MAKE BASED OFF ANY OF MY IDEAS. ONLY INVEST WHAT YOU CAN RISK TO AFFORD TO LOSE IF YOU MAKE THE DECISION TO DO SO. DO NOT INVEST, UNLESS YOU'RE PREPARED TO LOSE MONEY, IF NOT ALL.)
(CRYPTOCURRENCY CAN BE HIGH-RISK INVESTMENTS DUE TO THE VOLATILLITY OF IT'S NATURE, AND YOU SHOULD NOT EXPECT TO BE PROTECTED IF SOMETHING GOES IN THE WRONG DIRECTION. SEEK PROFESSIONAL ADVICE FROM A CERTIFIED FINANCIAL ADVISOR.)

Avax Premium SignalAlright, folks, check this out. I've got a premium signal straight from the consulting chatroom where we've been hashing things out. Our analysts are in on the juicy stuff, only dealing with insider info from the big players like market makers and whales. Forget about all that technical analysis mumbo jumbo when the heavy hitters are making moves. This deal's set to hit its targets in the next few weeks. None of that trend line or Fibonacci nonsense here. Our endgame? Making bank, plain and simple. And let me tell you, these free signals ain't gonna come around often. Use your noggin, do your own research, and make your moves wisely, alright?
