AVAX: Channel DownTrade setup : After getting rejected at $50 resistance, price has been pulling back, forming a Channel Down pattern. Notice that the price is also nearing oversold levels (RSI ~ 30) just as it approaches $25 support. That’s also 78.60% Fibonacci Retracement level (potential support) of $25.70. Hence, near term, we could see price bounce up to $30.
Pattern : Price is trading in a Channel Down pattern. With emerging patterns, traders who believe the price is likely to remain within its channel can initiate trades when the price fluctuates within its channel trendlines. With complete patterns (i.e. a breakout) – initiate a trade when the price breaks through the channel’s trendlines, either on the upper or lower side. When this happens, the price can move rapidly in the direction of that breakout.
Trend : Downtrend on Short-Term basis, Neutral on Medium-Term basis and Uptrend on Long-Term basis.
Momentum is Bearish (MACD Line is below MACD Signal Line, and RSI is below 45).
Support and Resistance : Nearest Support Zone is $25, then $19. The nearest Resistance Zone is $35 (previous support), then $50.
Avax

TLOS vs other alts performanceFor those having doubts about TLOS's performance since the bull run started at the end of October 2023, TLOS is on par with or significantly outperforming some of the major alts

AVAX: Thoughts and Analysis, potential low discussion.
Today's focus: AVAX
Pattern – 50% Fibbo, HL low analysis.
Support – 29.22
Resistance – 33
Hi, and thanks for checking out today's update.
Today, we are taking a look at AVAX (Avalanche) on the daily chart. Looking at price with a Fibonacci retracement tool on the chart, we can see that price lines up at the 50% point. This point also lines up with a previous high. We discuss the significance of the 50% Fib point and when price lines up with previous highs in today's update.
We have also run over what we are looking for to start calling a confirmed low and continuation. Signs are building, but buyers still have some work to do.
Good trading.

AVAX USDT LONG SWING | AVAXUSDT | LONG @ 14 - 16 | TP @ 16.5, 17, 17.5, 18, 18.5 | SL @ 11.5 | PATTERN = FALLING WEDGE | BINANCE |
Swing trade idea. Kindly follow targets and stop loss. Will update with new targets once all 5 are achieved. Mostly trading with PNF charts, MACD, RSI, Stoch, BPI, Cipher, MA/EMA, Support/Resistance on hourly timeframes and higher time frames.
BINANCE:AVAXUSDT BINANCE:AVAXUSD COINBASE:AVAXUSD BINANCE:AVAXUSDT.P KUCOIN:AVAXUSDT BYBIT:AVAXUSDT.P BITFINEX:AVAXUSD BITSTAMP:AVAXUSD OKX:AVAXUSD.P

back to breakeven(AVAX)📊Analysis by AhmadArz:
🔗"Uncover new opportunities in the world of cryptocurrencies with AhmadArz.
💡Join us on TradingView and expand your investment knowledge with our five years of experience in financial markets."
🚀Please boost and💬 comment to share your thoughts with us!

AVAXUSDT.1DBased on the given market data, the AVAX is currently trading at $33.22. The coin has a relatively neutral RSI on the 4-hour chart at 43.23, which means it's neither overbought nor oversold. The MACD on the 4-hour chart is negative, suggesting a bearish momentum.
The Bollinger Bands on the 4-hour chart indicate a possible resistance level at $34.56. The support levels are at $30.95, $29.22, and $25.46. If AVAX breaks below these support levels, we could see further downward movement. However, if it breaks above the resistance level of $37.73, it could test the higher resistance levels at $41.92 and $43.65.
On the daily chart, the RSI is slightly lower at 40.11, which may indicate a bearish trend. The MACD is also negative on the daily chart, further confirming the bearish momentum. The Bollinger Bands on the daily chart show a potential resistance level at $40.04. The support levels are at $30.92, $22.98, and $20.70. The resistance levels are at $41.88, $50.10, and $53.66.
The 7-day RSI is at 67.82, which is closer to the overbought territory. This could indicate a potential price correction in the near term. The MACD on the 7-day chart is positive, suggesting a bullish momentum. The Bollinger Bands on the 7-day chart show a potential resistance level at $47.63. The support levels are at $22.42, $8.75, and $3.00. The resistance levels are at $50.10, $54.0, and $63.25.
In conclusion, the short-term indicators suggest a bearish momentum for AVAX, while the 7-day indicators hint at a bullish momentum. It's essential to monitor the market closely and consider other factors before making investment decisions. Always remember that cryptocurrency investments come with high risks due to their volatile nature.

BITCOIN weekly roadmapGood time friends, I hope you are great.
According to last week's analysis, Bitcoin reached the range of $48,000 twice and could not go beyond this range.And from this area, it started its falling movement, this fall could be predicted both technically and the news that has come for Bitcoin during the last week.
Bitcoin is forming MTR in the daily time, it has broken the upward channel that we had downwards, the last bottom that I marked with a dashed line on the chart, below this range we also had a close candle.
In general, I see Bitcoin as bearish, this week I could not find a safe area for selling positions so that we can take swing selling positions.
But we can have buying positions in the range of (40000-41000) and (39400-39800) by getting appropriate approvals, if there is an opportunity for selling positions, I will inform you in the next analysis.

AVAX: Pullback in UptrendTrade setup : Following a bullish break above $35 key level, price reached our target of $50 resistance. However, price got very overbought (RSI ~ 82) and price has pulled back on some profit taking. The nearest horizontal support is $35 while the nearest Fibonacci Retracement levels (possible support) are $38 (38.20%), $34 (50%), and $31 (61.80%). Hence, pullback to $34-39 support zone could be an attractive swing trade entry area with upside potential back to $50. Stop Loss (SL) at $32 (just below prior swing low).
Trend : Downtrend on Short-Term basis and Uptrend on Medium- and Long-Term basis.
Momentum is Mixed as MACD Line is below MACD Signal Line (Bearish) but RSI ~ 50 (Neutral). MACD Histogram bars are rising, which suggests that momentum could be nearing another upswing.
Support and Resistance : Nearest Support Zone is $35, then $25. The nearest Resistance Zone is $50.

AVAX Technical Analysis• The AVAX price has advanced to a point where it has now breached its initial resistance area upwards, and we are observing pullback candles.
• Keep in mind, following the pullback's completion and the emergence of bullish patterns, the subsequent resistance zone becomes reachable.
(All analyses will be updated)
This analysis is informational, not financial advice.

AVAX JUST A LOOKING FOR SOMETHING :)Hi guys :) its been a while :)
Here we see an analogy in the Avax harmonic table that we have not looked at for a long time. it may be very simple data for someone. But since i think 2024 will be the year of "Real World Assets", i think the chart will work positively. it is not recommended to invest based on this study. Do your own technical and fundamental analysis without getting caught up in the manipulations on social media.
Have nice year :)

AVAX: Pullback in UptrendTrade setup : Following a bullish break above $35 key level, price reached our target of $50 resistance. However, price got very overbought (RSI ~ 82) and price has pulled back on some profit taking. The nearest horizontal support is $35 while the nearest Fibonacci Retracement levels (possible support) are $38 (38.20%), $34 (50%), and $31 (61.80%). Hence, pullback to $34-39 support zone could be an attractive swing trade entry area with upside potential back to $50. Stop Loss (SL) at $32 (just below prior swing low).
Trend : Uptrend across all time horizons (Short- Medium- and Long-Term).
Momentum is Mixed as MACD Line is below MACD Signal Line (Bearish) but RSI ~ 50 (Neutral). MACD Histogram bars are rising, which suggests that momentum could be nearing another upswing.
Support and Resistance : Nearest Support Zone is $35, then $25. The nearest Resistance Zone is $50.

AVAX PlanAVAX is in a good bullish momentum. I am long from the break of the trendline and i will wait a retrace and a bounce on the supply zone i drawed (green box) to add more to my longs. Tight invalidation just below green box

Riding the Upswing: #AVAX Long Trade Setup with Entry Strategies#AVAX long trade setup:
Entry Point:
Buy at CMP: Consider entering the trade at the Current Market Price (CMP), taking advantage of the current market conditions.
Additional Entry: Add more positions up to $37.4. This level is identified as a potential strategic buying opportunity.
Target Prices:
Set specific target prices at $41.5, $43.2, $44.7, $47, and $50. These levels represent potential profit-taking points as the price moves upward.
Stop Loss (SL):
Implement a mandatory stop-loss at $35.45. This level is chosen to effectively manage potential losses. A stop-loss is a risk management tool that automatically sells the asset if the price reaches a specified level, limiting potential downside.
Leverage:
The recommendation suggests utilizing leverage based on individual risk appetite. It emphasizes the importance of exercising caution and choosing leverage wisely. Leverage amplifies both potential profits and potential losses, so it should be used with care.
Cautionary Note:
Reminds traders to do their own research (DYOR) before making any trading decisions. This reinforces the idea that the provided information is not financial advice.
In summary, the recommendation outlines a long trade setup for #AVAX, providing specific entry points, target prices, and a mandatory stop-loss level for risk management. It also advises caution with leverage and underscores the significance of conducting personal research. As always, the information is not financial advice.

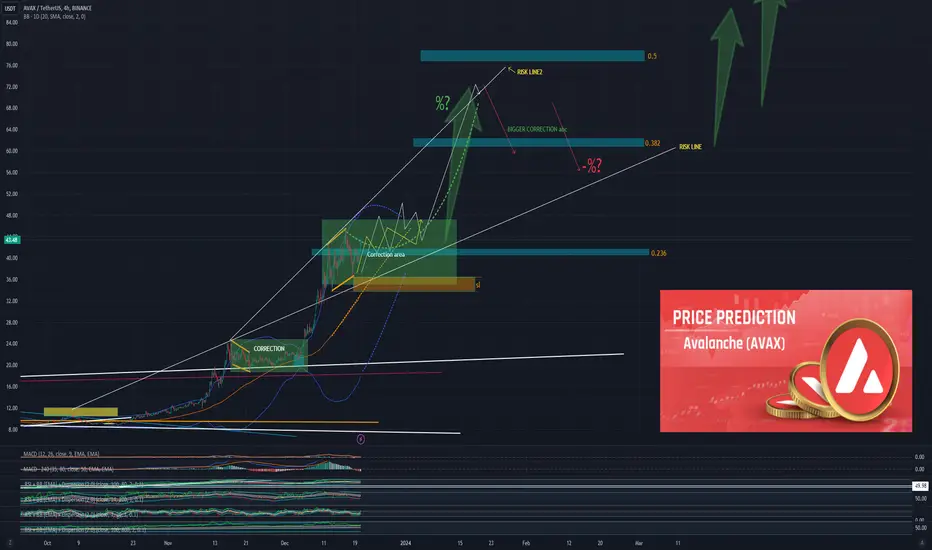
Avalanche PRICE PREDICTION *AVAX*Avax has been surprisingly strong and continues to do so with the latest strong wave.
It is likely to break above the $60 level with the last wave.
60 is the minimum and it is possible that it will be higher in reality, but at the moment no one knows what the real level is
After that, a bigger correction to make new higher highs.
Given the overall state of the crypto market, this is a possible reality
Don't forget to support the analysis if you agree.
MoralDisciple
AVAX/USDT Break the descending channel, Ready for continue up??💎 AVAX's market behavior has recently displayed remarkable dynamism. Currently, AVAX has made a notable breakout from its descending channel pattern and is in the midst of a retesting phase at a pivotal support level. This phase is crucial for AVAX to validate its breakout and continue its ascent towards a significant resistance target.
💎 However, if AVAX struggles during the retesting phase at the support level, exhibiting signs of failure or breakdown, it may indicate a false breakout. This scenario could potentially lead AVAX to revisit the demand area around 31.3, a critical juncture for determining its future trajectory.
💎 Historically, AVAX has demonstrated a strong rebound when reaching the demand zone, suggesting a similar potential response in the current context.
💎 Nonetheless, a lackluster reaction or inability to hold the demand zone could signal bearish trends, possibly leading to a breakdown of this area. Should this occur, AVAX's next directional move could be towards the Bullish OB area, marking a key area for future market movements.

#AVAXDue to the formation of a descending structure in the lower times H1-H4, we see lower floors and ceilings and a corrective formic. Therefore, if the stabilization candle is not recorded above $37.5, this correction will continue and the first target of this correction will be the $25 range. Therefore, any pullback to the range of $37.5 and especially candle rejection will confirm the downward trend in the low time.

AVAX may bounce backAVAX has returned to its previous trend and could start a new move from here. The positive atmosphere that may occur with the ETF news may start a new rally. Can be entered with spot or low leverage.

AVAX: Pullback in UptrendTrade setup : Following a bullish break above $35 key level, price reached our target of $50 resistance. However, price got very overbought (RSI ~ 82) and price has pulled back on some profit taking. The nearest horizontal support is $35 while the nearest Fibonacci Retracement levels (possible support) are $38 (38.20%), $34 (50%), and $31 (61.80%). Hence, pullback to $34-39 support zone could be an attractive swing trade entry area with upside potential back to $50. Stop Loss (SL) at $32 (just below prior swing low).
Trend : Neutral on Short-Term basis and Uptrend on Medium- and Long-Term basis.
Momentum is Bearish (MACD Line is below MACD Signal Line, and RSI is below 45).
Support and Resistance : Nearest Support Zone is $35, which it broke, then $25. The nearest Resistance Zone is $50.

In trend-bear (AVAX)📊Analysis by AhmadArz:
Next break renge
🔍Entry: 33.416
🛑Stop Loss: 34.504
🎯Take Profit: 32.346
🔗"Uncover new opportunities in the world of cryptocurrencies with AhmadArz.
💡Join us on TradingView and expand your investment knowledge with our five years of experience in financial markets."
🚀Please boost and💬 comment to share your thoughts with us!

Bear market may be starting.AVAX has created a H&S on the 12h timeframe. If it breaks the purple support level, it is over for the bulls.

AVAX: Pullback in UptrendTrade setup : Following a bullish break above $35 key level, price reached our target of $50 resistance. However, price got very overbought (RSI ~ 82) and price has pulled back on some profit taking. The nearest horizontal support is $35 while the nearest Fibonacci Retracement levels (possible support) are $38 (38.20%), $34 (50%), and $31 (61.80%). Hence, pullback to $34-39 support zone could be an attractive swing trade entry area with upside potential back to $50. Stop Loss (SL) at $32 (just below prior swing low).
Trend : Neutral on Short-Term basis and Uptrend on Medium- and Long-Term basis.
Momentum is Mixed as MACD Line is below MACD Signal Line (Bearish) but RSI ~ 50 (Neutral).
Support and Resistance : Nearest Support Zone is $35 (previous resistance), then $25. The nearest Resistance Zone is $50.

⚡️AVAXUSDT CMC TRADING ⚡️ HEAD & SHOULDER AVAXUSDT has recently breached a critical support level following the formation of a head and shoulders pattern. This development indicates a significant potential downward movement to finalize the structural breakout. Anticipating a retracement towards the trend line identified on the daily timeframe is our outlook.

