AVAX LOOKS BEARISHBy hitting the red lines, which are daily supply, the price has turned downwards and a bear CH has been formed and the trend line has been broken. It is expected that after a little fluctuation and the efforts of buyers, the price will move towards the specified target
For risk management, please don't forget stop loss and capital management
Comment if you have any questions
Thank You
Avax

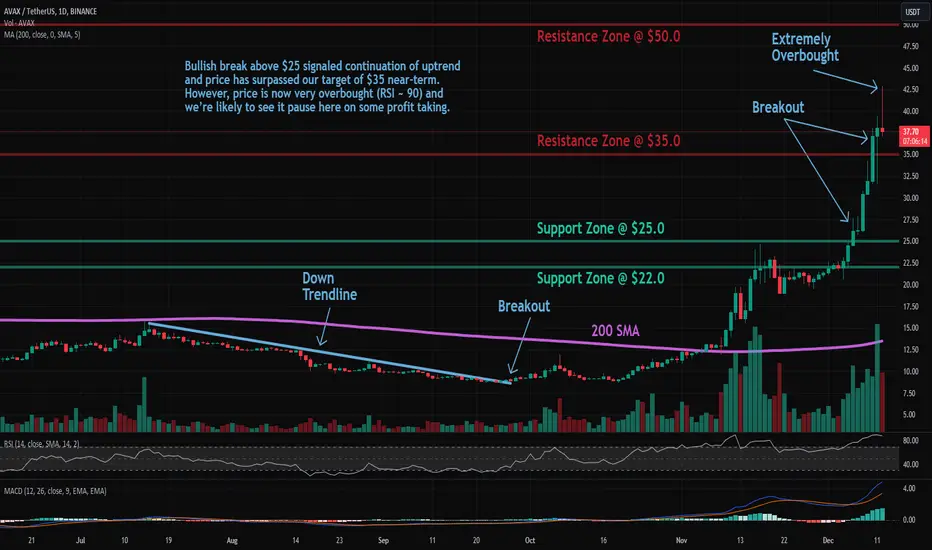
AVAX: Resistance BreakoutAvalanche (AVAX) technical analysis:
Trade setup : Bullish break above $25 signaled continuation of uptrend and price has surpassed our target of $35 near-term. However, price is now very overbought (RSI ~ 90) and we’re likely to see it pause here on some profit taking.
Trend : Uptrend across all time horizons (Short- Medium- and Long-Term).
Momentum is Bullish but extremely overbought. ( MACD Line is above MACD Signal Line). RSI is bullish (> 55) but extremely overbought (> 80) which could imply that price could briefly pause or pull back if it reaches Resistance.
Support and Resistance : Nearest Support Zone is $25 (previous resistance), then $20. The nearest Resistance Zone is $35, which it broke, then $50.
AVAX/USDT Bracing for a Bullish Journey?👀 🚀Avax Today Analysis💎 Yello paradisers, spotlight on #AVAXUSDT as it unfolds a compelling narrative in the crypto trading landscape. Nestled within a demand zone and having recently executed a Market Structure Shift (MSS), it is showing strong signs of a potential bullish uptrend.
💎 Delving into #Avalanche's market trajectory reveals a pattern of strategic moves. AVAX has a history of meticulously following a descending trendline, only to break above it, ushering in upward movements.
💎 Presently, CRYPTOCAP:AVAX is poised to challenge a notable Bearish Order Block (OB), with its recent MSS trajectory adding credence to bullish prospects. Moreover, a deep dive into its performance shows it sustaining robust momentum above the EMA100, hinting that if this upward trend continues, targets at $31.13 and $41.34 supply levels may well be within reach.
💎 However, in the fluid crypto market, #AVAX traders should be prepared for varying outcomes. If the expected bullish breakout falters, a rebound strategy from the support level of $19.59 becomes essential.
💎 A drop below this support level would necessitate a strategy shift, indicating a need to reassess the bullish outlook and adapt trading strategies accordingly. 🌴💰

AVAXUSDT.P perfomance in 2023 till DecemberLooking back at 2023. Although the cryptocurrency market is in a difficult process. But there has been some pretty good growth recently. This is the backtest result from the beginning of the year until now of AVAX perp (AVAXUSDT). It can be automated.

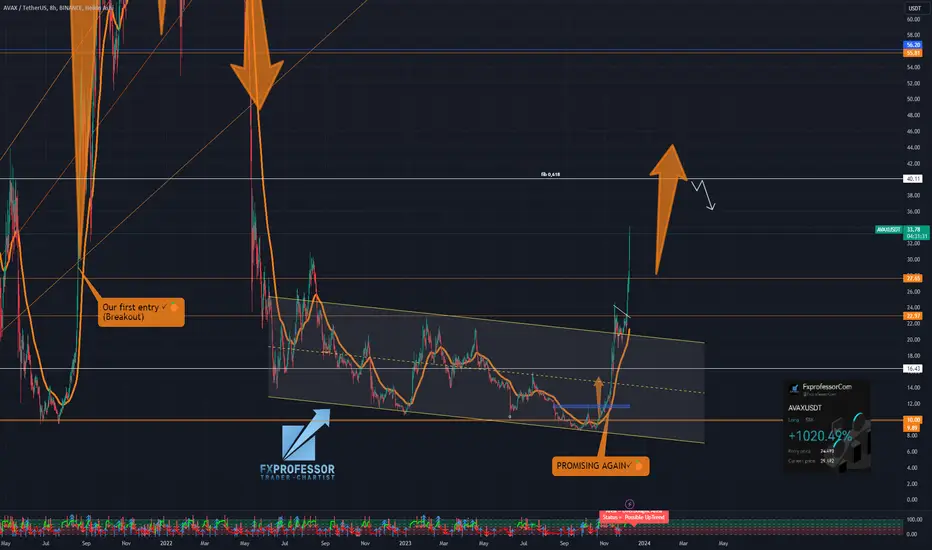
AVAX Avalanche: Scaling the Crypto TerrainHey Crypto Warriors! 👋 The FXProfessor here, exploring the exhilarating peaks of AVAX Avalanche. Let's dissect its current momentum and plot our course through this dynamic crypto landscape!
AVAX Avalanche's Market Dynamics:
📈 Experiencing Robust Growth: AVAX is not just climbing – it's soaring.
🎯 On the Radar: Aiming for pivotal targets as AVAX continues its ascent.
Key Support and Resistance Levels:
🛑 Solid Support: Watch out for crucial support levels that bolster confidence.
🧗♂️ Climbing to New Peaks: Breaking certain thresholds could signal a rally to new heights.
Strategic Outlook:
📊 Navigating through AVAX’s volatile landscape requires a keen eye and a steady hand.
⚡ Every step counts – whether it's a cautious hold or a strategic trade.
Long-Term Potential:
🌌 Exploring the potential for significant gains as AVAX challenges its limits.
🔭 Keeping a close watch on its trajectory towards ambitious long-term goals.
Trading Approach:
🌟 Patience and thorough analysis are crucial in harnessing AVAX's potential.
📝 Stay adaptive to its dynamic market movements.
FXProfessor's Insights:
🌐 AVAX isn't just another crypto; it's a bold player reshaping the digital asset space.
🔄 Regular updates to come as we track its thrilling journey.
Let's strategize wisely, stay ahead of the curve, and conquer the crypto mountains together!
One Love,
The FXProfessor 💙
ps. be careful not to FOMO.. We follow the market and chart levels
Celebrate the Avalanche's Unstoppable Rise!
It brings me immense pleasure to inform you that Avalanche continues to dominate the crypto space, with its price soaring higher than ever before, effortlessly surpassing the moving average. This remarkable achievement is a testament to the incredible potential and resilience of the Avalanche ecosystem.
Are you ready to ride the wave of success with Avalanche? If so, then consider this idea your invitation to join the Long Avalanche Movement today
Here's why I believe Avalanche is a golden opportunity worth exploring:
1. Unparalleled Performance: Avalanche has consistently outperformed market expectations, demonstrating its strength and stability amidst turbulent times. Its upward trajectory has been extraordinary, instilling confidence and excitement among traders worldwide.
2. Innovative Technology: Powered by Avalanche's groundbreaking consensus protocol, the platform offers lightning-fast transactions and low fees, making it an attractive choice for both institutional and retail investors. The ecosystem's commitment to innovation and scalability sets it apart from the competition.
3. Growing Adoption: Avalanche's popularity is on the rise, with an increasing number of projects and developers choosing to build on its robust infrastructure. The expanding ecosystem clearly shows the platform's widespread acceptance and potential for long-term growth.
So, how can you get involved and seize this opportunity? Here's your call to action:
1. Research and Educate Yourself: Dive into the world of Avalanche and familiarize yourself with its unique features, use cases, and potential. Understanding the technology and its implications will empower you to make informed investment decisions.
2. Stay Updated: Keep a close eye on Avalanche's latest news, project updates, and market trends. Follow reputable sources, join the community forums, and engage in discussions to gain valuable insights and stay ahead of the curve.
3. Take Action: When you feel confident and ready, consider adding Avalanche to your investment portfolio. Whether you're a seasoned trader or a beginner, there are various avenues available to participate in the Avalanche ecosystem, including spot trading, staking, and yield farming.
So, what are you waiting for? Join the Long Avalanche Movement.

✨ AI Precision Scores Big in Live Trading! 📈🤖Hey Tradingview Fam!
We just saw the future last night , and guess what? It fits right in your pocket! Our AI tool rocked the charts from a phone, making calls like a boss. 📉➡️📈
This magic isn't just for the wizards of Wall Street; it's for the rookies and the trading titans among you. Let's always remember trading is powered by us, humans. AI is going to be our ultimate tool to get better and enjoy our trading more 👩💻👨💼
Imagine this: an AI that adapts to your style, learning the ropes from you. Think of it as your trading twin, keeping your head cool when the market heats up. 🧠🔥
And it's zooming our way, faster than we thought. With every tick of the market, our AI is leveling up. 💪
We're stepping into an era where AI merges the savvy of top traders into one powerhouse, enhancing our strategies and decisions. 🤖💡
Big shoutout to everyone joining this journey. Together, we're not just trading; we're evolving, smarter and stronger. 🚀🧠💪
Thank you for being part of this transformative leap. The future's looking bright, and it's ours for the taking. 🌟🛣️✨
One Love,
The FXProfessor 💙
Live stream: www.tradingview.com

Brief Analysis——AVAXIn November, the Inscription and BRC-20 themes became popular in the market. After that, many chains followed Ordi and launched inscriptions on their chains. For example, AVAL, NEAT, POLS, etc. This action brought attention, caused the gas fee on the chain to rise rapidly, and the token price also rose. Benefiting from this, AVAX's performance in December was ahead of most other tokens in the market. So one month after the last report on AVAX was released, let’s check what's going on with AVAX now?
Avalanche is an classic blockchain, but we can see that after many new and interesting narratives emerged this year, Avalanche has not fallen behind. AvaGPT, Stars Arena, Aval and Benqi were hot topics in each cycle. This also reflects the willingness of developers to build dapps on the Avalanche ecosystem.
Before the analysis, we saw that many tokens, including AVAX, had a correction a few hours ago, but we looked at the news from analyst James Seyffart or about the BTC ETF, and there was no bad news about the BTC ETF. On a macro level nothing has changed. We know your concerns.
On the daily level, the ME indicator shows that AVAX is in a bullish trend and the purple wavy area is widening. From the WTA indicator, we can see that the last round of rise was supported by many blue bars representing whales. And the bullish trend ends with the appearance of a destructive candle (shown by the red arrow). After that, although the rise ended, the bears did not strengthen. AVAX remained fluctuating for about 15 days and began a new round of rise. In this round of rise, AVAX has risen faster, but not many whales are involved. This shows that most whales believe that at this point, above 26 is not a good entry point.
In summary, AVAX is a token worth paying attention to as it can create additional Alpha. However, the base of this round of rise is not solid. If destructive candles appear in the subsequent time, then this round of rise may end.
Disclaimer: Nothing in the script constitutes investment advice. The script objectively expounded the market situation and should not be construed as an offer to sell or an invitation to buy any cryptocurrencies.
Any decisions made based on the information contained in the script are your sole responsibility. Any investments made or to be made shall be with your independent analyses based on your financial situation and objectives.

Avax confirming the log channel breakout.You can see on this log chart that Avax has confirmed a breakout above the yellow channel. On its way to the breakout target it has los broken above an inv h&s neckline. This is a very asymmetrical inverse head and shoulders pattern as we can see the right shoulder is extremely tiny and the head appears to be Siamese. All the same if this inverse head and shoulders pattern also validate the breakout target for it is around $56. *not financial advice*

🏔️ Avalanche (AVAX) Insights 🚀Avalanche's price has skyrocketed recently, especially in the past few days. However, I anticipate that we might be approaching the end of this upward trend, and a significant correction for Avalanche could be imminent. Looking at the recent price action starting from the low in September, we've completed a Wave 1, followed by a Wave 2 correction, a swift Wave 3 with a quick Wave 4 beside it, and currently, an impulsive Wave 5 in progress.
While a short-term correction might be on the horizon, I still anticipate that even with a shorter correction, Wave 5 will likely conclude, possibly in early 2024. Subsequently, we might see a downturn towards the $25 to $16 range. The exact timing remains to be seen, but it seems like Avalanche's current high levels might not be sustained for much longer. 📉💨

AVAX/USDT In the crucial zone. Break out or rejected ??💎 AVAX has undeniably captured significant attention in the market. Currently positioned in a crucial area, it is encountering a robust supply zone. Today's closing candle, characterized by a strong green bullish engulfing pattern and a flawless bounce from the support area, hints at the possibility of an AVAX breakout in this region. Such a breakout would signal a bullish trend for AVAX, probability leading to a substantial upward movement toward our target area.
💎 However, if AVAX fails to overcome the formidable resistance of the strong supply area, facing a significant rejection, there's a likelihood of a retracement. AVAX may retreat, retesting the support area and potentially reaching the demand zone. It's noteworthy that AVAX is yet to undergo a retesting phase after breaking out of the descending channel. The demand area also coincides with the resistance trendline of the descending channel. If the support fails to hold, AVAX might experience a decline, testing the demand.
💎 The bad scenario is confirmed if, during the retesting phase at the demand area, AVAX fails to maintain its position and undergoes a breakdown. In such a case, AVAX would shift back to a bearish movement, potentially retracing to the key support area.

EGLD/USDT it required break the resistance to continue upward!!💎 EGLD has undoubtedly captured significant market attention. It executed a flawless breakout from the supply area, marked by substantial volume and a robust green bullish candle. However, encountering a formidable rejection in the resistance area prompted EGLD to initiate a retesting phase at the demand area spanning $38.20 to $36, which previously served as the supply area.
💎 Presently, EGLD is in a consolidation phase within the range of the resistance and demand areas. To sustain its upward momentum, EGLD needs to break out of the resistance. A successful breakout holds the probability for EGLD to smoothly ascend and reach our target area. However, failure to attempt a breakout in the near future may lead EGLD back to testing the demand area.
💎 In the event that EGLD revisits the supply area of $38.20 to $36 and undergoes a breakdown of the demand area, there's a likelihood of EGLD descending to the subsequent lower demand zone at $33 to $30. EGLD retains a chance for an upward reversal, contingent on a bounce from the demand area at $33, reclaiming the support level at $38.20.
💎 The unfavorable scenario unfolds if, during the retesting at the demand, EGLD struggles to sustain its position and breaches the demand area. In such a scenario, EGLD would revert to a bearish movement, potentially retracing to the robust support area.

AVAX IS BULLISHBefore this, we thought that we were inside a diametric because all the rules for a diametric structure were followed. But the financial market is not always a single scenario
With recent pumps our next scenario is a triangle. The range of flip and ob is the right place to buy avax to the higher targets of Makki
We specified the first TP. When the first TP is broken, AVAX can go up to the ATH

AVAX: Overbought at ResistanceTrade setup : Bullish break above $25 signaled continuation of uptrend and price has surpassed our target of $30 near-term. However, price is now very overbought (RSI ~ 75) just as it reached that $35 resistance. Hence, near-term, we’re likely to see it pause here on some profit taking. Previously, price broke above 200-day moving average, which confirmed a bullish trend reversal to an Uptrend.
Trend : Uptrend across all time horizons (Short- Medium- and Long-Term).
Momentum is Bullish but extremely overbought. ( MACD Line is above MACD Signal Line). RSI is bullish (> 55) but extremely overbought (> 80) which could imply that price could briefly pause or pull back if it reaches Resistance.
Support and Resistance : Nearest Support Zone is $25.0 (previous resistance), then $22.0. The nearest Resistance Zone is $30.0, which it broke, then $35.0.

AVAX INCREASE VOLUME ( READY FOR NEW BREAK)Thank you for reading this update.
Depending on our study we see that AVAX has a good chance of volume increase.
This updates depending on day trade, And the market should confirm with time the right market way.
AVAX is known as building coins and it can show in the coming time frames a break.
We looking to the $13-14 level where the break can start.
$17 is an important level in combination with $21.40
We know this coin from the historical increase that started at JULE 2021 with $9.70 and ended in NOV 2021 with $146
SINCE THIS COIN IS UP $10 it entering a high-volume area.
#Nottradingadvice

AVAXUSDT - Quick chart Idea - Possible breakout to the upsideHi to all TV people, this is a quick chart idea. By looking it looks bullish.
I would trade only after a retest of this possible breakout. First need to break through resistance.
Upside target could fail only on a breakout on downside of this triangle.
Trade is a matter of probability, but it's safer to trade reacting on a price action not trying to anticipate patterns.
This is my idea, not financial advice. Always DYOR.
ShadowPlayer.

Avax Target - Good short entryAVAX analysis - Elliott Wave Perspective
After an impulsive uptrend, Avax seems to be losing momentum and consolidating. Now that it has reached its highest points, it may be time for a wave of downward movement.
According to the Elliott Wave perspective, AVAX is currently in the final wave of an impulse wave. This means that we will soon see a correction, but there will still be one last upward move. I am personally taking a short position between $28.00 and $28.50 for the following reasons:
- 1 to 1 extension of wave 1
- 1.618 extension (expanded flat)
- Bearish divergence (RSI)
- Correlation Main count BTCUSD (Related ideas)
It is important to note that the Elliott Wave perspective is based on historical price movements and patterns, and future price action can never be predicted with absolute certainty. Markets can be volatile and unpredictable, so it is always wise to trade cautiously and manage your risks.
Remember, financial markets are inherently volatile, and investing is always a personal choice. It is crucial to conduct thorough research, carefully assess your risk tolerance, and form your own judgment before making any trading decisions.

AVAX moon waning or waxing? Elliott waveIf you find this information inspiring/helpful, please consider a boost and follow! Any questions or comments, please leave a comment! Also, check out the links in my signature to get to know me better!
WXY posted caught the pivot dece! 🧵
Here is my ideal path for the bulls IF it stays above
25.
Then 30?

#AVAX/USDT 4h (ByBit) Ascending trendline breakdownAvalanche lost 50MA support and seems to be heading towards 200MA.
⚡️⚡️ #AVAX/USDT ⚡️⚡️
Exchanges: ByBit USDT
Signal Type: Regular (Short)
Leverage: Isolated (2.7X)
Amount: 4.9%
Current Price:
20.800
Entry Targets:
1) 21.465
Take-Profit Targets:
1) 15.010
Stop Targets:
1) 24.700
Published By: @Zblaba
CRYPTOCAP:AVAX BYBIT:AVAXUSDT.P #Avalanche avax.network
Risk/Reward= 1:2.0
Expected Profit= +81.2%
Possible Loss= -40.7%
Estimated Gaintime= 5-10 days

AVAX/USDT Bullish Prospects A Closer Look? 👀 🚀Avalanche💎 Paradisers, let's delve into the intriguing dynamics of AVAXUSDT. The recent shift from supply to demand zones indicates a strong likelihood of a bullish trend.
💎 Reflecting on its historical pattern, AVAXUSDT has consistently overcome its descending channel, leading to upward movements. Currently, with the transformation of supply into demand, there's a heightened chance of embarking on a bullish journey from this newfound demand level. The primary expectation is a breakthrough of the formidable resistance at 21.93, followed by a move to counteract the bearish Order Block (OB).
💎 On the flip side, if AVALANCHE struggles to maintain its upward momentum, a bullish strategy from the demand level of 15.19 may come into play. At this juncture, while some newcomers might resort to panic selling, the key is to wait for a definitive break below this demand level before making calculated trading decisions.

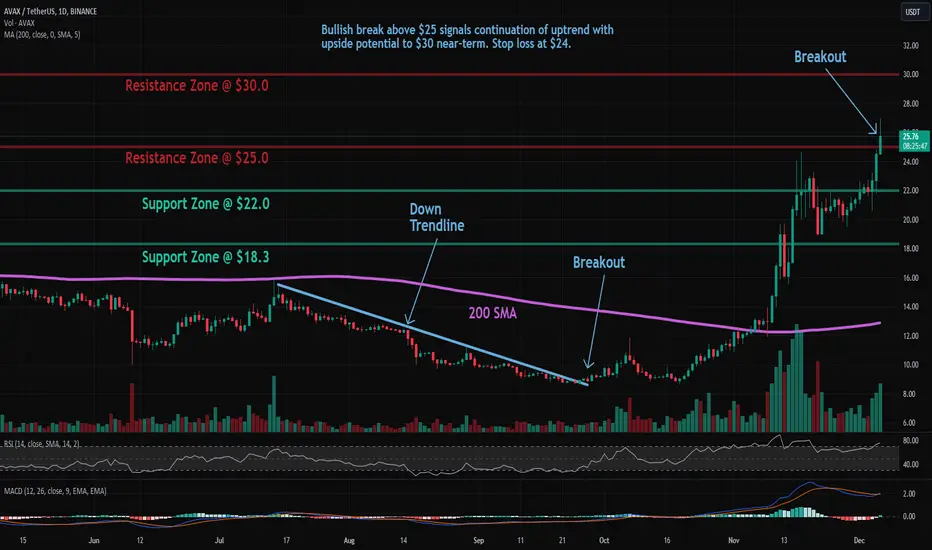
AVAX: Resistance BreakoutAvalanche (AVAX) technical analysis:
Trade setup : Bullish break above $25 signals continuation of uptrend with upside potential to $30 near-term. Stop loss at $24. Previously, price broke above 200-day moving average, which confirmed a bullish trend reversal to an Uptrend.
Trend : Uptrend across all time horizons (Short- Medium- and Long-Term).
Momentum is Bullish (MACD Line is above MACD Signal Line and RSI is above 55).
Support and Resistance : Nearest Support Zone is $22.0 (previous resistance), then $18.3. The nearest Resistance Zone is $25.0, which it broke, then $30.0.
Bull-channel (AVAX)❤️❤️Thanks for boosting 🚀 and supporting us!
📈we are in bull-channel so our position on buy and high channel level for next target.
📊 (Buy) : 22
🔴 Stop Loss : 21.11
🎯 Take Profit : 22.77 - 23.66 - 24.33
🔗 For more communication with us, send a message in TradingView.
👨🎓 Experience and Education: Our trading team has five years of experience in financial markets, especially cryptocurrencies.
