AVAXUSDT 1HAVAXUSDT 1H
SUPPORTS 18.82 / 18.55
RESISTANCES 19.31 / 20.00
RSI Exhaustion of purchasing forces
MACD: Optimistic
AVAX climbed to the psychological resistance of HKEX:20 and experienced a rejection tonight, returning to levels below that resistance.
On-chain data reveals intense developer activity and growing demand, so I believe that in the next few hours AVAX will go back above psychological resistance and head towards 28, which is my target for the month of April
Avax

Volatility Period: April 19-21Hello?
Traders, welcome.
If you "Follow", you can always get new information quickly.
Please also click "Boost".
Have a good day.
** Analysis of the BTC chart publishes new ideas once a week.
** However, we publish new ideas when volatility occurs or when we show signs of diverging from our expectations.
** Excluding the above situation, BTC analysis is listed as a daily update.
-------------------------------------
(AVAXBTC 1W Chart)
The question is whether it can rise above 0.0009 187.
If not, we need to see if it finds support around 0.0006 306 and breaks out of the downtrend line.
-----------------------------------------------
(AVAXUSDT chart)
During the volatility period around April 20 (April 19-21), it is necessary to check whether it can show a move out of the 19.16-23.96 zone.
If not, it should be sideways in the 19.16-23.96 zone to confirm the next volatility period around the 15th of May.
-------------------------------------------------- -------------------------------------------
** All descriptions are for reference only and do not guarantee profit or loss in investment.
** Even if you know other people's know-how, it takes a considerable period of time to make it your own.
** This is a chart created with my know-how.
---------------------------------

AVAXUSDT 1HAVAXUSDT 1H
It continues in an upward trend, giving a show in the graphic analysis! Circulating above MM200 demonstrates clear buyer dominance, plus AVALANCHE has launched a new subnet system called “Evergreen Subnets” which is made specifically for financial institutions. Evergreen subnets will provide blockchain solutions, tools and other services to these big financial players, which will further fuel their rise.
Here are the supports and resistances:
Supports 21.01 / 20.61
Resistances: 21.65 / 22.00
RSI : Seller
MACD: Buyer
MM200: 19.24
EMAS : Pointed upwards, the asset generally follows the movement of the EMAS

AVAX 20% profit. 100% more to come !#AVAX / USD Update:
AVAX is currently trading at $20.54
According to Coinlion Trend Trader Indicator, AVAX is currently bullish.
We entered AVAX at $17.16 (03/31/2023) and already took some profits the days (14.15.16.17 of march) Exit 50% of our position (20% profit)
AVAX has crossed the descending channel that we have since 08/14/2022 and if the support and 200EMA holds at $19.17 we might see a huge performance.
Next target : $42.25
What do you think ?
Please click LIKE button and Appreciate my work.
Coinlion Trend Trader indicator tells me
- When to enter short or long
- When to exit and take profit :-)
IF YOU WANT we can give you the link to our free indicators :
- Stop Loss indicator
- Liquidity Support and Resistance Indicator
- Buy and Sell signal
- Automatic Fibonacci Levels with Higher and Lower Lows
Let us know
Thank you.

🔥 AVAX Breaking Through 8-Month ResistanceAVAX has finally broken out of a 8-month pattern. With some luck, this might be the start of a new bullish era for AVAX, which has arguably been lagging a large portion of the market.
Keep in mind that BTC took a dive today, so the current break out might be a fake-out. I'm waiting for tomorrows candle.
In case of a confirmed break out, targets in blue.

✴️ AVAX 5X But Why Not More? (Beyond 500% Potential)I shared a new trade signal for AVAXUSDT and went with 5X, why not more?
Back in December and January, we do 10X easy because we can clearly see a bottom pattern and the initial breakout taking place.
In March we can clearly see correction ending but things can change.
Since the pair is already moving, since we are no longer near support/multi-year low, we reduce the risk and that's why 5X and no more.
People can always increase or reduce the leverage as they see fit.
You can always use more collateral and so on...
Leveraged trading is for experts only, there is high risk involved.
High risk with a very high potential for reward.
We are live on this pair and Matic 5X as well.
This is not financial advice.
See you at the TOP!
Namaste.

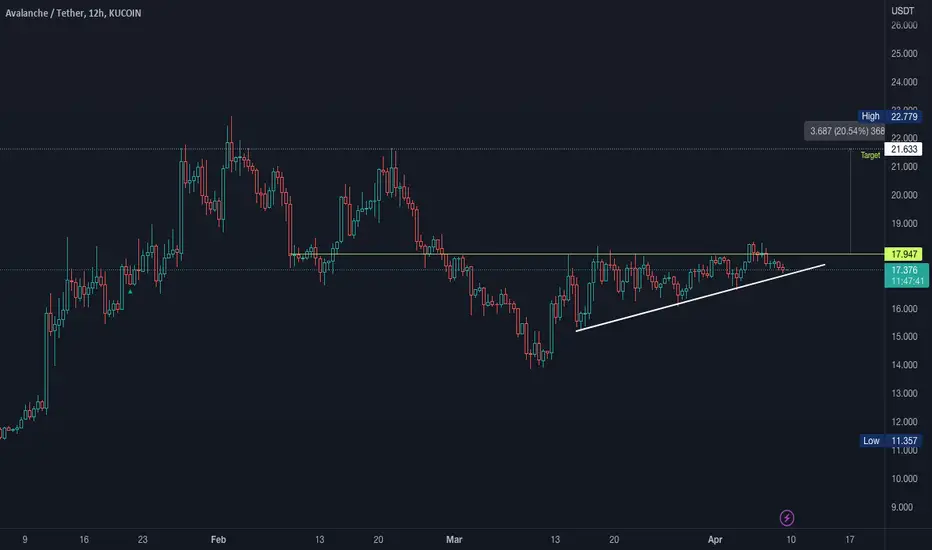
AVAX USDT | Perfect risk / reward ratio!#AVAX/USDT
🟢Entry price: from 17.47 to 16.6
🟢 or you can trade the breakout of 17.5 for more safe entry
🟢 Also, waiting for a confirmation of breakout by closing the current weekly candle above 17.44 will be perfect!
🎯Targets:
|> 20
|> 23
|> 28
🔴Stop-loss: Weekly candle closes under 16.6
➡️Recommended risk: 0.25%
➡️Recommended Position Size for entry point #1: 2.5%
➡️Recommended Position Size for entry point #2: 5%

AVAX reversal in tha making 📈AVAX just flipped 50 weeks moving average
This is usually a very strong reversal signal
I am expecting much more upside in the next months 📈


AVAXUSDTHello friends, this analysis is a falling analysis and in a very low time frame, upward movement is possible for the last upward movement.

AVAX three taps clearPrice since June 2022 is in a drawn range and will see some consolidation in certain areas. Based on the price movement, now BINANCE:AVAXUSD has touched three taps on the marked section and could re-test the previous resistance.
This is an overview of what will be my trading plan to take partial profits, namely:
TP1: $19.61
TP2: $22.26
TP3: $25.63
and change each TP to SL+
note: this is not a solicitation of investment, all risks are borne by each only expressing opinions and personal opinions

AVAX USDT - LONG The possibility of the price going up right now or after touching the downward trend line is broken and the middle of the channel is resistance and the ceiling of the ascending channel is likely.
(it is clear in the picture)

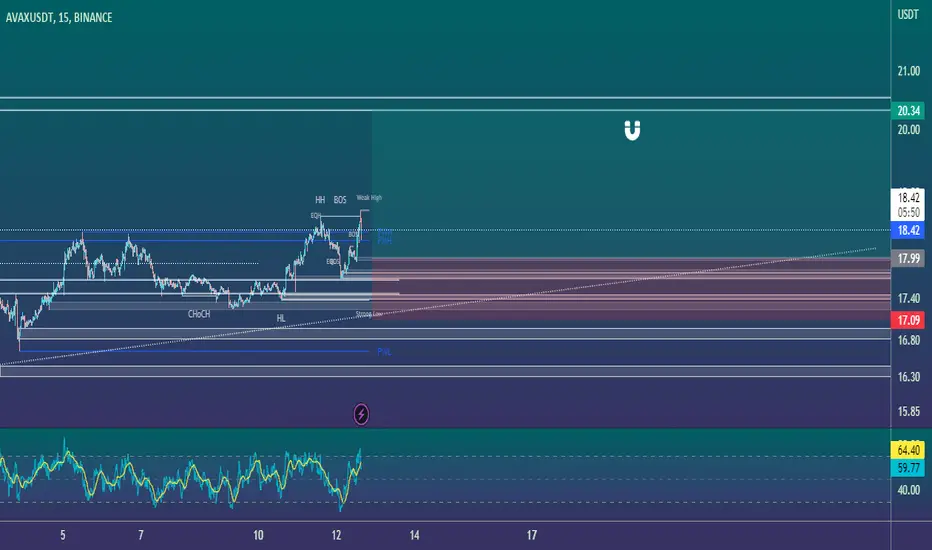
AVAX/USDT🔵🐇AVAX/USDT
🪄AVAX Scalp Position Based On Fresh Liquidity and Order Blocks and Structures
#avax #avalanche #eth #btc #bitcoin #ethereum #cryptocurrency #crypto #Trade #trading #Trader #Signal #forex #Scalp #altcoins #chart #RTM #ICT
AVAX BUILD UP BREAKOUT!KUCOIN:AVAXUSDT
AVAX price action is squeezing for an imminent move following Bitcoin.
Read my post about Bitcoin earlier today.
Possible upside 20% and if Bitcoin rejects look for shorts to structure.
Higher Lows back into neckline, looking like a possible build up to break out.
Always having Plan A and Plan B scenarios so we can react once the markets provide an opportunity to execute our edge.
If you liked this idea or if you have your own opinion about it, write in the comments.
The information and publications are not meant to be, and do not constitute, financial, investment, trading, or other types of advice or recommendations.
AVAX - Road to 2024Typical bear market trend structure so far, keep printing LL - LH - LL - LH.
It looks like we are to print another LL.
I started DCAing BUT my bags are small as usual since it’s just the the first week of 50 week of accumulation for me.
IMO we are gonna start 2023 with a bear market rally and print the LH.
Winter is long, bags are small, bags will get heavier with time.

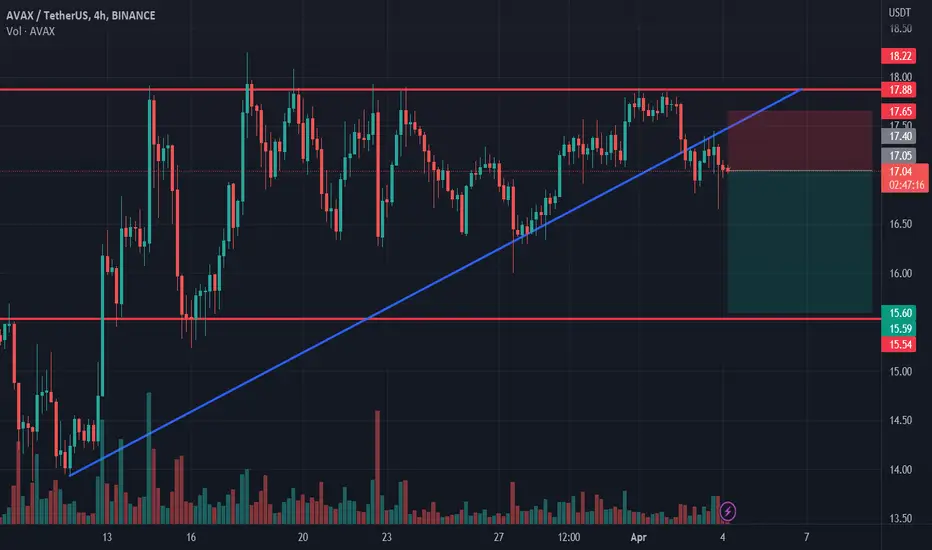
AVAX shortAVAX bounced off the resistance level. Asset broke trough off the ascending trendline. Bearish movement to support level at 15.55 is possible.

Avax Ready For a Brake Out?Simple daily line chart with simple TA.
If Avax manages to bounce from its current level it could posed for a ABC correction pushing it up another 100%.

AVAXUSD Significant upside potentialAVAXUSD is trading inside a Channel Up having formed a Golden Cross (1d) 6 weeks ago.
The RSI suggests that one last pullback is possible before a new 1 month rally starts.
Trading Plan:
1. Buy on the next pullback to the MA200 (1d).
Targets:
1. 25.00 (top of the Channel Up).
Tips:
1. The ideal buy entry would be when the RSI (1d) hits the 30.00 oversold level again.
Please like, follow and comment!!

AVAX/USDT🐇AVAX/USDT
🪄AVAX looks like bullish with a bullish structure
- you can see scalp setup in the chart
- there are 2 fresh liquidity for Tp
#avax #avalanche #eth #btc #bitcoin #ethereum #cryptocurrency #crypto #Trade #trading #Trader #Signal #forex #Scalp #altcoins #chart #RTM #ICT

AVAX shortAVAX bounced off the resistance level. Asset broke trough off the ascending trendline. Bearish movement to support level at 15.6 is possible.
DOGE ADA and other altcoins with pump potentialHere are some #crypto #altcoins that have PUMP opportunity being that, IMO, we're out of $BTC bear
$DOGE low 70's ath = 10x
+/or
$SHIB own .000005ish
$ADA Already own low 30's
$AVAX @ 14.75, upped position few days ago
Have more risk for appetite?
$PLA
Have spoken on these countless times
Prices still fairly low imo

Potential Wash out before retracement to fulfill bull flag AVAXAvalanche has been in a 10 day range potentially filling out a bull flag formation. After the flag broke on the daily chart the trend became bearish wicking down back into the flag. This does not invalidate the flag, but if you like myself entered Avalanche early in the pole formation you could either exit on that first breakout or hang tight with a stop loss. The absolute level of a stop loss for a longer-term trade would be the red line. The blue lines are key levels within the past few months.

$HNT/USDT comebackAfter $HNT delisted from Binance I will be waiting for a coom back by on $HNT.
If trendline breakes I will be waiting a pump till $2.519.
Not financial advice DOYR.
