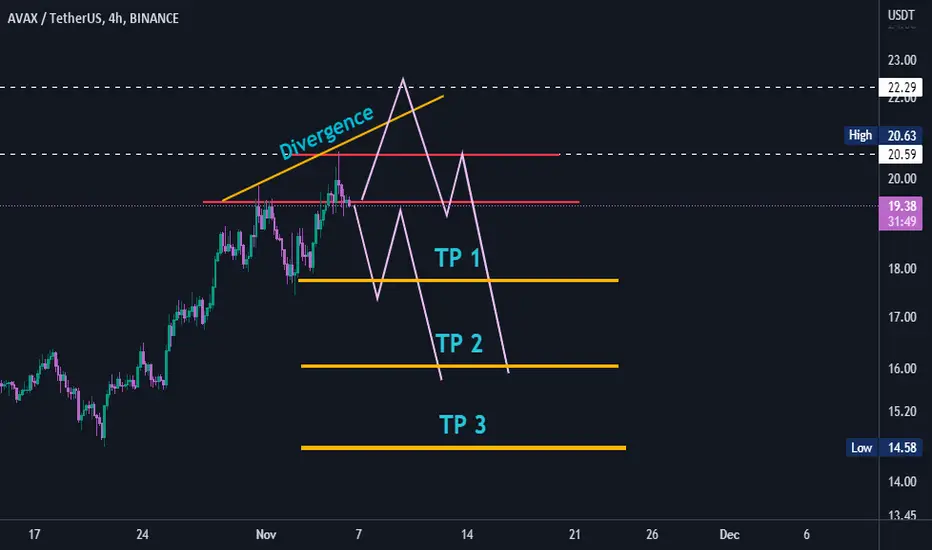
🔥EASY MONEY ON AVAX: ENJOY THE CHANNEL TRADING❗ 🔥 Hi friends! Avalance have the special pattern from the very beginning of it's listing on exchange. It trades in the channels more than any other altcoins that I have already seen. It's 5th GLOBAL channel for the last 2 years.
📊 The trading in channel is very simple. I recommend you to trade it in 3 ways:
🔥 the pullbacks after the test lower/upper boudary of the channel
🔥 the breakout of the channel after 5-6 test
🔥 the false breakout, when the price return inside the channel
✅ These 3 methods is very usefull, especially for beginners. Such trading aproaches don't bring you a millions of $ in 2 month, but it's a big advantages to know how to use it. The most profitable are 1st and 3rd from my trading experience.
🚩 Current situation on crypto market is not clear. BTC make a pullback and possibly will go up, but AVAX squeezing to the lower boundary of the channel which is bearish signal.
Friends, as you already know, If BTC go up, all the alctoin follow it. So the same can heppen in this case too.
📊 When BTC will go up, I have such targets for AVAX:
1. $14 - the key level
2. $16-17 - the upper boundary of the channel and local resistance
3. $20 - the key level and local high
🚩 Traders, do you find another channel that I don't marked? Share you screeenshots with the last channel in the comments!
Also if you want know more about the channels trading, let me know in the comments or DM.
💻Friends, press the "boost"🚀 button, write comments and share with your friends - it will be the best THANK YOU.
P.S. Personally, I open an entry if the price shows it according to my strategy.
Always do your analysis before making a trade
Avax

AVAX - Buying SignalBYBIT:AVAXUSDT.P
1H time frame
-
An inverse HS is forming on 1H chart.
Also we can open long after getting rid of the downtrend.
-
Entry: BO
TP: 13.92, 14.5
SL: 12.5

AVAX's chart has become very similar to the Bitcoin's!AVAX has gained in price over the past week in the 4-hour time frame. According to the divergences formed on the RSI indicator and the breaking of the resistance of the downward trend line, as expected, the price of Avax had good growth up to the range of $13.3. But we can clearly see a range area in the 4-hour timeframe. A resistance was considered for Awax last week in the range of $13.26-$13.45, which has seen a negative reaction, with the price closely touching this area.
Also, a support area in the range of $12.4 to $12.7 is considered on the chart, and the price is ranging between these levels. In the 1-hour time frame, the AVAX chart has become very similar to the Bitcoin chart. Therefore, considering this high correlation, we can better understand the behavior of Awax by considering the movement behavior of Bitcoin. If Bitcoin continues its upward movement, Avax could break the current resistance to the $14.8-$15 level. This resistance overlaps with the midline of the Avax descending channel, and the probability of a negative reaction at this level is high.

AVAX Long SetupLooks Good Following Dow Theory Also with Bullish Candlestick Patterns. Weill see how this turns out :)

Avalanche (AVAX) - November 24Hello?
Traders, welcome.
If you "Follow", you can always get new information quickly.
Please also click "Boost".
Have a good day.
-------------------------------------
(AVAXBTC 1W Chart)
In order to get the power to rise, it must be supported in the range of 0.0007 164 to 0.0009 769.
---------------------------------------
(AVAXUSDT 1W Chart)
The 15.44-20.30 interval is the one that determines the trend.
Therefore, it is important to be supported by rising to the 15.44-20.30 section.
However, the 13.47 point is the volume profile section, and if resistance is received at 13.47, there is a possibility of falling to around 6.54, so you need to think about countermeasures.
(1D chart)
It will be important if the price can quickly rise above 13.47 and sustain the price.
If this is not the case, it may lead to further declines, so cautious trading is required.
-------------------------------------------------- -------------------------------------------
** All descriptions are for reference only and do not guarantee profit or loss in investment.
** If you share this chart, you can use the indicators normally.
** The MRHAB-T indicator includes indicators that indicate points of support and resistance.
** SR_R_C indicators are displayed as StochRSI (line), RSI (columns), and CCI (bgcolor).
** The CCI indicator is displayed in the overbought section (CCI > +100) and oversold section (CCI < -100).
(Short-term Stop Loss can be said to be a point where profit or loss can be preserved or additional entry can be made by split trading. This is a short-term investment perspective.)
---------------------------------

AVAX Short SetupAs it failed to break the trendline and is also forming a Bearish Candle Stick Pattern ( Evening Star ) We Should see it back at the Support

Technical analysis of AVAXPrice is moving down respecting a resistance line I expect price to reach the 3h demand zone around $12.3 before moving up again from there towards the 3h supply at $13.6.

AVAXUSDT, 1HBINANCE:AVAXUSDT Potential Bearish Shark
Potential Reversal Zone:
BC Retracement (1.618 | 2.618)
Near: 13.79262
Far: 14.228
XA Retracement (0.886 | 1.13)
Near: 13.88285
Far: 14.1773

AVAXUSDT planpossible double bottom forming but that basically depends on BTC... still has a long way to go though, claim 13.5 claim 4H trend.

AVAX Short term outlookAVAX is currently rangebound after potentially creating a double bottom reversal.
Longs built from the red support zone would have targets of 13.5 and 14.6 respectively before major resistance
The red support zone needs to hold and rally convincingly from if there is to be any hope in the short term for the bulls. Failure to hold that area then the double bottom is all that's stopping AVAX from reaching double figures.
Not financial advice

lets go up boyshello
i wated so much to get into this point.
you see 2 possibilities.
i will go for long positions here but still there is drop chance of course.
saty safe.
hope you play nicely ;)

DefiLlama: Total Value Locked in Blockchainsℹ️ This is a complementary study of the idea below, where I analyzed the TVL of the main dApps:
Basically, here's a more macro view of DeFi ecosystems.
Making a very crude analogy, dApps would be like the banks of the physical world, while blockchains would be the cities/countries where these banks reside.
Total Value Locked in Blochchains
Ethereum continues to reign isolated in the lead.
Binance Smart Chain follows in second place, followed by Tron, AVAX, Matic, Optimism, Cronos, Solana, FTM, among others.
Last on this list are Ethereum Classic and Ethereum PoW.
The chart still does not show Solana's decrease, which is currently at $656.23m.
I believe it is due to a delay.
That's a 24% drop from the previous day.
Now it remains to see the scenes of the next chapters.

AVAX technical analysisPrice bounced off a weekly demand zone where it then got rejected off the resistance at $15.6. I expect price to trade deeper into the weekly demand zone. Before potentially moving up again

Avalanche (AVAX) - November 10Hello?
Welcome, traders.
By "following", you can always get new information quickly.
Please also click "Boost".
Have a good day.
-------------------------------------
(AVAXBTC 1W Chart)
The key is whether the 0.007164-0.009769 zone can support and move up.
If the price holds above 0.009187, it is expected to dissipate strength.
-----------------------------------------
(AVAXUSDT 1W Chart)
The key is whether it can be supported by rising to the 15.44-20.30 section.
To do that, we need to see if it can rise above 13.47.
(1D chart)
The key is whether it can rise above 13.47 and find support.
If it doesn't, there is a possibility that it will move towards the 7.72 area, so be careful.
------------------------------------------------------------ -------------------------------------------
** All descriptions are for reference only and do not guarantee a profit or loss in investment.
** If you share this chart, you can use the indicators normally.
** The MRHAB-T indicator contains indicators that indicate support and resistance points.
** SR_R_C indicators are displayed as StochRSI(line), RSI(columns), CCI(bgcolor).
** CCI indicator is expressed as overbought range (CCI > +100) and oversold range (CCI < -100).
(Short-term Stop Loss can be said to be a point where profit and loss can be preserved or additional entry can be made through split trading. It is a short-term investment perspective.)
---------------------------------

Avax (Quick update) Shorthi everyone
sorry for late update
i was busy on my new office
every thing is clear on chart.
avax is broken dynamic support and will go more down from here,
please share your opinion in the comments
I consider all analyses performed in relation to that trade position.
Our analysis is not a buy or sell referral.
If you found our analysis useful and interesting, feel free to share it so that more individuals might benefit from it.
And please don't forget to like and comment; we will read them all.

AVAXUSDT 1D TARGETS and STOPLOSSHello everyone, let's take a look at the 1D AVAX to USDT chart as you can see the price is moving above the local uptrend line.
Let's start by setting goals for the near future that we can consider:
T1 - $ 18.74
T2 - $ 21.01
T3 - $ 23.32
T4 - 25.35
and
T5 - $ 28.14
Now let's move on to the stop loss in case of further market declines:
SL1 - $ 16.53
SL2 - $ 14.14
SL3 - $ 12.22
SL4 - $ 10.16
and
SL5 - $ 7.43
Looking at the CHOP indicator, we can see that in the 1D range the energy has increased significantly, and the MACD indicator shows a downward trend.

AVAX right now analysis || ArztopiaBINANCE:AVAXUSDT
First wait for top
next find an entry price
now best position for short.
please support me in socioal media
just search arztopia on media
AVAX shortAVAX broke trough the support level. Asset broke trough the ascending trendline. Bearish movement to support level at 15.7 is possible.

AVAX - Similar Double Bottoms AVAX has printed a nice double bottom which is very comparable to a past double bottom that saw great bullish results
A double bottom is a bullish reversal pattern
Bull opportunity

AVAX/Usdt 1 day line avalancheAVAX/Usdt 1 day line
avax dollar 1 day line
avax marketcap long
coin altcoin
avalanche

AVAX wave 5 impulse on the MTF wave stochastic indicatoranother example of how to interpret the waves with the help of the MTF wave indicator. you can see wave 5 starts with MTF being oversold. you mainly need to look at the green curve which then forms a wave up, then diverges at the top with a tap up from gray and blue time frame stochastics, followed by more green stoch wave decline as well as a clear entry for short through that last fakeup . for those who dont know, the fakeup is when gray stoch bounces up alone with a clear gap between it and the blue stoch.

AVAXusdt 6H in the channel In the chart, we see an ascending channel, if the bottom of the channel is maintained, we expect the price to rise to the top of the channel, and otherwise, we will see a drop to the support areas by losing the channel.
Its not Buy or Sell SIGNAL
DYOR
BY : M.TeriZ - @AtonicShark

$avax double bottom just above previous double bottom$avax is giving a double bottom just on the support of the previous ATL which was a double bottom as well.
Looks like a textbook reversal.
Good luck.
Look at my previous takes on the market and see how we did.
