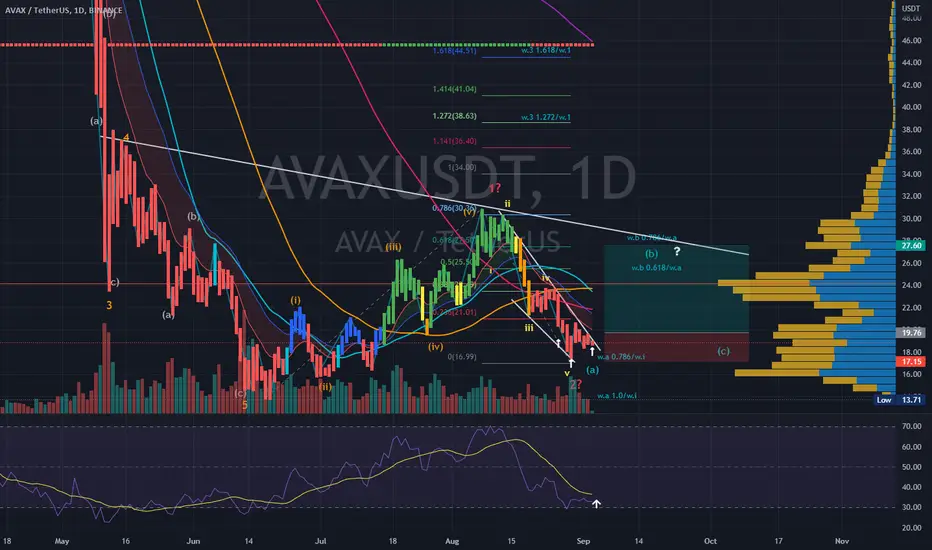
AVAXif wave y is over, fix 1 may be doing 2 now, or it will be wave x assuming btc will drop further.
Avax

AVAXBNB 1DAfter the brutal price drop between April 3rd and May 26th AVAX/BNB lateralized and fell again. Meanwhile, technical factors also point to the upside in various indicators, starting with RSI oversold, in addition the MM200 puts a gravitational pull on the asset pulling up. This reinforces our bullish conviction in the coming days.

AVAX/USDT - “I” ALIGN WITH “ME” @110.542 KUCOIN:AVAXUSDT
Expansion out of a contacted price zone (33.601) - Accumulation began mid May for this Wycoff natured daily expansion phase reversal.
BUY POSITIONS -
P1: 13.045
P2: 17.961
P3: 24.656
P4: 30.783
P5: 33.601
TAKE PROFITS -
TP1: 24.656
TP2: 30.783
TP3: 33.601
TP4: 69.572
TP5: 110.542
I regret to inform you that stop losses are a myth and do just as they say, incur loss. If your feeling emotional just place a stop at break even although proper risk management with leverage and or your margin being managed intelligently will make this an extremely pleasurable trade.
This one was a tricky one because during the liquidation phase and liquidity fills AVAX was pushed into contraction at (30.783) again causing mainly retail to sell more AVAX and further liquidations although institutions and whales were thinking the opposite and still taking profits, as well as accumulating inventory for the upcoming trend pointed out on the chart above. The next at (24.656) where new buys were placed by mainly retail traders because at this point the asset becomes somewhat feminine in its nature and structure after masculine impulsive sell moves cease abruptly. This slower vibrational activity drainage begins when volumes dither and confusion and panic sets in.
Do not be fooled though remember it is a paradox and one of degree: Higher resolution (time-frame) expansions (corrections) can be traded by experienced and skilful investors who understand how the market really moves and in fact 90% of traders will be in this phase on lower time frames 90% of the time within around 90 days you’d have been through a cat 12 typhoon, capsized and all your collateral lost at sea while “Pirates escape in a spaceship with your inventory!…”
Further buys were then placed at 17.196 after yet further but not yet finalised liquidation bear phases. Prices then returned into the zone created by the three aforementioned contractions bracketed and explained above in attempts to settle AVAX’s value. This was confirmation that 24.656 is the AVAX equilibrium with 13.045 looking very much like a final liquidation zone as the liquidity here is needed for the imminent trend.
The panic and volatility that can be seen in these price fluctuations during expansions is scary and will ruin you if you get caught in a higher time expansion on a lower time frame with no understanding! Understand first or eat bread and drink water.
Have interest, this creates a cycle of attention-interest, more attention meaning more interest and will grow into a concentration and further to a focus and on to higher mind vibrations of concentration and focus that bring understanding and knowledge from the ether. Give your newly obtained knowledge to action and receive yet more knowledge which you now begin the process of having interest in that new knowledge and the cycle continues. This is how brain market structure works lol…
Read this over and make AVAX your ticket to higher dimension and degrees of reality and use your winnings selflessly, intelligently and only for the good of humanity. Any monies made from this idea that are used negatively will reverse manifest and become yet again unseen. You were warned.
TRADEGOD

AVAX - Ready... ! G O . . . - in short and mid termAvalanche is a layer one blockchain that functions as a platform for decentralized applications and custom blockchain networks. It is one of Ethereum’s rivals, aiming to unseat Ethereum as the most popular blockchain for smart contracts. It aims to do so by having a higher transaction output of up to 6,500 transactions per second while not compromising scalability.
This is made possible by Avalanche’s unique architecture. The Avalanche network consists of three individual blockchains: the X-Chain, C-Chain and P-Chain. Each chain has a distinct purpose, which is radically different from the approach Bitcoin and Ethereum use, namely having all nodes validate all transactions. Avalanche blockchains even use different consensus mechanisms based on their use cases.
After its mainnet launch in 2020, Avalanche has worked on developing its own ecosystem of DApps and DeFi. Different Ethereum-based projects such as SushiSwap and TrueUSD have integrated with Avalanche. Furthermore, the platform is constantly working on improving interoperability between its own ecosystem and Ethereum, like through the development of bridges.
Buy setup
Entry : 16.70 - 20.45
SL : 14.39
TP1: 21
TP2: 21.8
TP3: 22.8
TP4: 24
TP5: 25.5
TP6: 27.5
TP7: 30
TP8: 33
TP9: 37
TP10: 42
TP11: 48
TP12: 56
TP13: 65
TP14: 75
TP15: 87
Spot or Future (1x, 2x, or 3x)
Run and keep it enjoy!
Follow me! Copy my trade!

avax long term analysisIt seems to be supported at the bottom of the rising channel, and if it maintains it, it has the ability to grow to the midline in the long term

avax market updateIf the descending channel breaks, it will have the ability to grow up to the important target of $22

AVAX longAVAX bounced off the lower boundary of ascending channel. Bullish movement to resistance level at 20.8 is possible.

Avalanche (AVAX) - September 15Hello?
Welcome, traders.
By "following", you can always get new information quickly.
Please also click "Like".
Have a good day.
-------------------------------------
(AVAXUSDT 1W Chart)
It is important to be supported in the 15.44-20.30 section.
(1D chart)
The interval 15.44-20.30 is the interval that determines the trend.
So, if it is supported and rises, it is expected to rise further.
The section where the HA-High indicator is horizontal is expected to receive primary resistance in the section 23.96-28.48.
However, once supported, the uptrend is expected to continue.
If you drop from 13.47, you need a Stop Loss to get cash.
We are currently breaking out of the medium-term bearish channel and are within the short-term bullish channel.
Therefore, it is important to be able to move higher than 20.30.
------------------------------------------------------------ -------------------------------------------
** All descriptions are for reference only and do not guarantee a profit or loss in investment.
** The MRHAB-T indicator, which is inactive on the chart, contains indicators that indicate support and resistance points.
** Background color of Long/Short-S indicator: RSI oversold and overbought sections
** Background color of CCI-C indicator: When the short-term CCI line is below -100 and above +100, oversold and overbought sections are displayed.
** The OBV indicator was re-created by applying a formula to the DepthHouse Trading indicator, an indicator disclosed by oh92. (Thanks for this.)
(Short-term Stop Loss can be said to be a point where profit and loss can be preserved or additional entry can be made through split trading. It is a short-term investment perspective.)
---------------------------------

AVAXBNB - the overbought RSI is making the pair a little heavy, AVAXBNB - the overbought RSI is making the pair a little heavy, but as soon as it licks the lower edge of the Keltner Channel it should impulsively rally (as AVAX moves with impulsive moves) and hit the $0.07268 target.


AVAX: analysis for September 13The resistance level with the upper border of $20.60 was broken on the Daily timeframe on September 11. The trend is bullish now and the impulse wave develops.
A pullback buying opportunity will appear after the correction formation on the Daily timeframe. The new resistance level that can be formed around these price marks or the highs of August 23 – 26 will be the target for the bullish movement continuation after the correction is finished.
In case of successful development of the trend, a more distant target will be on the highs of August 12 – 14, where the next resistance is located with the borders of $29.45 – $30.35.
When breaking through the support, the trend will reverse and we should look for selling opportunities. The borders of this level are $17.90 – $18.25.
Longs will remain relevant until the market is above the nearest support level on the Daily chart, the lows of September 6 – 7.

AVAXUSDT|Coin Review| Area of interest closeHello trader Today I prepared a new idea for you. Like and subscribe to the channel there is a lot of useful information✅
AVAX after growth by 17% is in the stage of correction, I have identified for myself an area of interest of $19.95, that's where I placed my order to buy a long position.
If the asset can successfully consolidate at the level of 0.236, then I expect continued growth towards $22 (10% without leverage)

Avax buy zonesBased on time and price analysis, I showed two important buy zones in the chart.. faster time means lower price and vice versa...


Avax Bouncing off SupportShort term long position targets at .5 and .618 fib levels we have a “W” formation at the support with confirmation from retest, sloploss below support

📊 Avalanche(AVAX) give you a chance: where to open a long?Hi friends! Another altcoin make a pullback and give you the opportunity to open a nice long.
✅AVALANCHE is close to the biggest value area which become the huge support if BTC fall to $17500. As you all know the alts follow BTC.
Now the price consolidate inside the triangle and broke it down woth high possibilitty. This is your chance to enter the long. 📊 Preconditions to open a long:
🔥 false breakout of the triangle or test the huge support area of $15.6-17
🔥 squeeze to the upper trenline
🔥 volume growth which confirms the pressence of buyer
🔥 bullish BTC
🚩 Additionall precondition for me will be the HUGE buy orders of the whales. They appear when the price reach the huge support levels like this. I prefer to open the trade in the same direction with the big players.
📊 The targets:
1. $20.49 -the key level and even number.
2. $23-25 - the value area and HUGE resistance. I thimk after such big accumulation it will be easilly broken.
💻Friends, press the "boost"🚀 button, write comments and share with your friends - it will be the best THANK YOU.
P.S. Personally, I open an entry if the price shows it according to my strategy.
Always do your analysis before making a trade.

short AVAX$AVAX bounced off the resistance level. Decline to support level at 17,76$ is likely to happen.

AVAX, having info on competitors not necessarily bad... Opinion:
Short term trade. TP1 at 25$! :)
Each level L1-L3 (S1-S3) and TP1-TP3 has a deployment percentage. The idea is to flag these levels so I can buy 11% at L1 , 28% at L2 and if L3 deploy 61% of assigned dry powder. The same in reverse goes for TP. TP1: 61%, TP2:28% and TP3:11%. If chart pivots between TP's and L's these percentages are still respected. I like to use the trading range to accumulate by using this tactic.
Just my personal way of using this. This is not intended or made to constitute any financial advice.
This is not intended or made to constitute any financial advice.
FED Macro Situation Consideration:
All TP's are drawn within the context of a return to FED neutral policy. I do not expect these levels to be reached before tightening is over.
NOT INVESTMENT ADVICE
I am not a financial advisor.
The Content in this TradingView Idea is for informational purposes only, you should not construe any such information or other material as legal, tax, investment, financial, or other advice. Nothing contained within this idea constitutes a solicitation, recommendation, endorsement, or offer to buy or sell any securities or other financial instruments in this or in in any other jurisdiction in which such solicitation or offer would be unlawful under the securities laws of such jurisdiction.
All Content on this idea post is information of a general nature and does not address the circumstances of any particular individual or entity. Nothing in the idea/post constitutes professional and/or financial advice, nor does any information on the idea/post constitute a comprehensive or complete statement of the matters discussed or the law relating thereto. You alone assume the sole responsibility of evaluating the merits and risks associated with the use of any information or other Content on the idea/post before making any decisions based on such information.

AVAXUSDT | Wave Projection | Bullish Wedge Ending DiagonalPrice action and chart pattern trading setup
> Elliott Wave analysis possible 2-wave ending diagonal pattern with bullish momentum - a potential falling wedge breakout scenario
> Entry @ 2-wave bullish wedge breakout and EMA10 TF24H
> Target @ upper downtrend line resistance 0.618 - 0.786 retracement of 1-wave zone + 30- 40%
> Stop @ the lowest 2-wave position -10%
> Risk reward ratio: 2:1 / 3:1
Indicator:
>RSI bullish momentum about to cross MA line
>MACD bullish momentum just below signal line
Always trade with affordable risk and respect your stop
Trading opportunity for AVAXUSDT AvalancheBased on technical factors there is a Long position in :
📊 AVAXUSDT Avalanche
🔵 Long Now or by Breakout
🧯 Stop loss 16.91
🏹 Target 1 23.50
🏹 Target 2 27.20
💸Capital : 1%
We hope it is profitable for you ❤️
Please support our activity with your likes👍 and comments📝

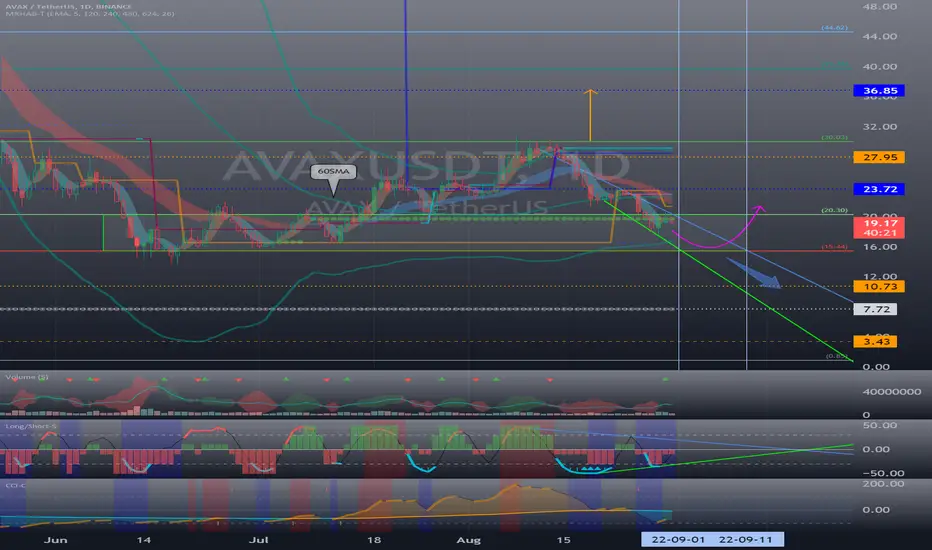
Avalanche (AVAX) - September 1Hello?
Welcome, traders.
By "following", you can always get new information quickly.
Please also click "Like".
Have a good day.
-------------------------------------
(AVAXUSDT 1W Chart)
The key is whether the 15.44-20.30 zone is supported and able to rise.
(1D chart)
To get out of the downtrend channel, we need to see if we can find support in the 15.44-20.30 zone.
In particular, you need to make sure that the price remains above 20.30 after around the 9th or 11th.
If they can't get out of the bearish channel, they could move towards the 7.72-10.73 section.
------------------------------------------------------------ -------------------------------------------
** All descriptions are for reference only and do not guarantee a profit or loss in investment.
** The MRHAB-T indicator, which is inactive on the chart, contains indicators that indicate support and resistance points.
** Background color of Long/Short-S indicator: RSI oversold and overbought sections
** Background color of CCI-C indicator: When the short-term CCI line is below -100 and above +100, oversold and overbought sections are displayed.
** The OBV indicator was re-created by applying a formula to the DepthHouse Trading indicator, an indicator disclosed by oh92. (Thanks for this.)
(Short-term Stop Loss can be said to be a point where profit and loss can be preserved or additional entry through split trading. It is a short-term investment perspective.)
---------------------------------
Trading Idea LONG AVAXUSDT it's the weekend and I've had enough of the black script. so for me, with low leverage and a small amount, I spend on some sold-out coins. If it was basically lower, I would buy more on the individual supports. it can't rain all year round.

AVAX H4 potential bullish reversal AVAX looks to be entering an inverse head and shoulders bullish reversal.
invalidation of this pattern at ~$19.40, potential to the upside going into resistance at $22 and $23 respectively where some chop should be expected if this setup plays out.
NOT FINANCIAL ADVICE
