AVAX – Hidden Chance for Latecomers🔥AVAX – High-Potential Setup Amid Market Catch-Up
While many crypto assets have surged in the recent bullish wave, AVAX appears to have been left behind — and that could present a high-reward opportunity ahead.
From both a fundamental and on-chain perspective, this project shows promising signs, especially with notable activity among whale wallets. I believe AVAX has the potential for a strong long-term rally — but there’s one critical condition to watch.
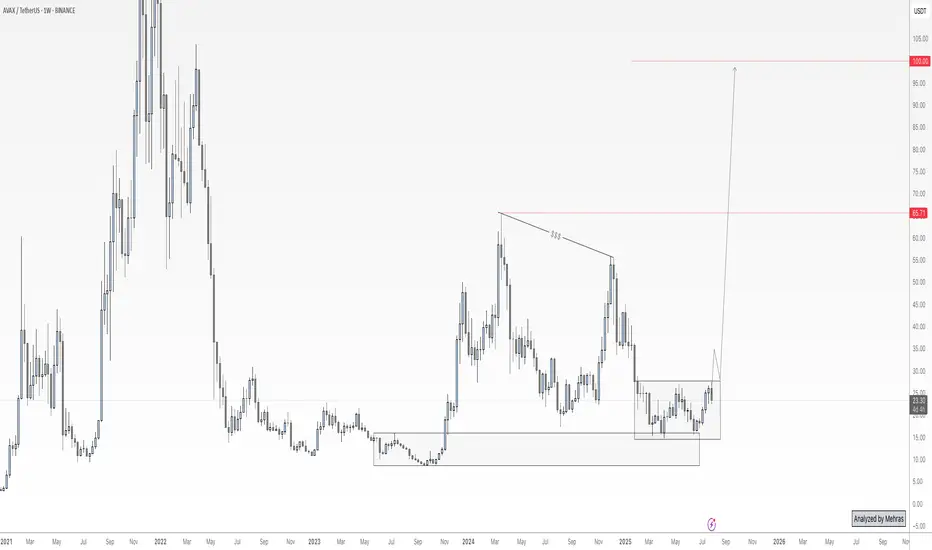
Price has recently reacted to a key custom demand zone. However, for confirmation of buy-side strength, we need to see a clean breakout and daily close above the ~$28 level. If that breakout is confirmed, I’ll be looking to accumulate for a long-term hold, with a target of $65 — and possibly up to $100 if momentum continues.
That said, risk management remains my top priority. I’ll allocate no more than 3–4% of my total portfolio to this position.
Keep an eye on the $28 breakout. If the trade is triggered, I’ll provide updates here.
🔁 This analysis will be updated whenever necessary.
Disclaimer: This is not financial advice. Just my personal opinion.
Avaxanalys
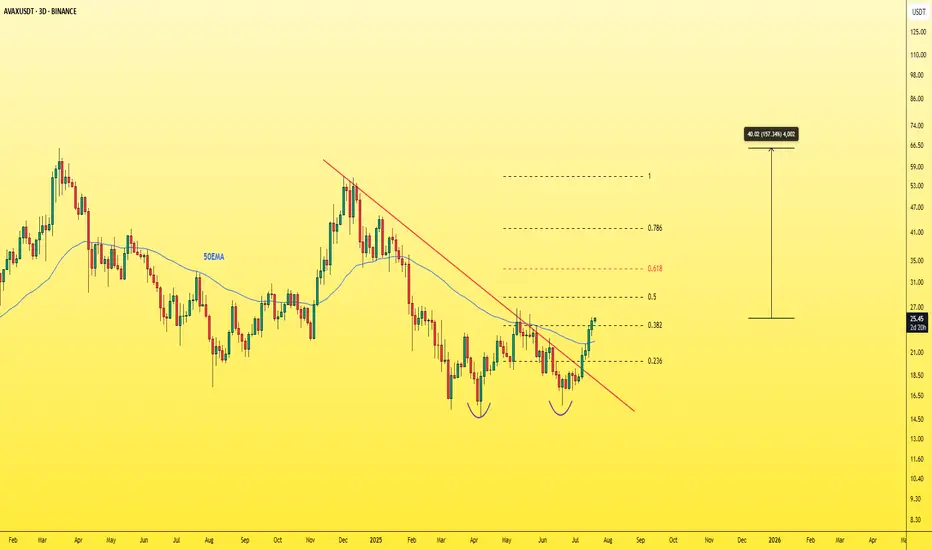
AVAXUSDT - THE real treasure must be hunted!Let's not forget about CRYPTOCAP:AVAX — it's one of the must-have assets in any crypto portfolio.
Currently trading at a discounted price after dropping from its previous top at $55, AVAX now shows strong bullish potential with plenty of upside ahead.
🚀 Key bullish signs:
-Successfully broke through multiple resistance levels, including the 0.382 Fibonacci retracement, 50 EMA, and the main descending trendline.
-A daily close above the 26$ level is a very positive signal.
With a solid project, reliable fundamentals, and low risk compared to potential reward, this could be a highly profitable opportunity.
Don’t sleep on it.🎯
AVAXUSDTWe are bear-trend but wait for break trendline and pollback to 18.50$.
BINANCE:AVAXUSDT
Support: 16.90
Resistance: 18.50 - 21.30 - 25.50
⚠️Control money management.

avaxpump"🌟 Welcome to Golden Candle! 🌟
We're a team of 📈 passionate traders 📉 who love sharing our 🔍 technical analysis insights 🔎 with the TradingView community. 🌎
Our goal is to provide 💡 valuable perspectives 💡 on market trends and patterns, but 🚫 please note that our analyses are not intended as buy or sell recommendations. 🚫
Instead, they reflect our own 💭 personal attitudes and thoughts. 💭
Follow along and 📚 learn 📚 from our analyses! 📊💡"

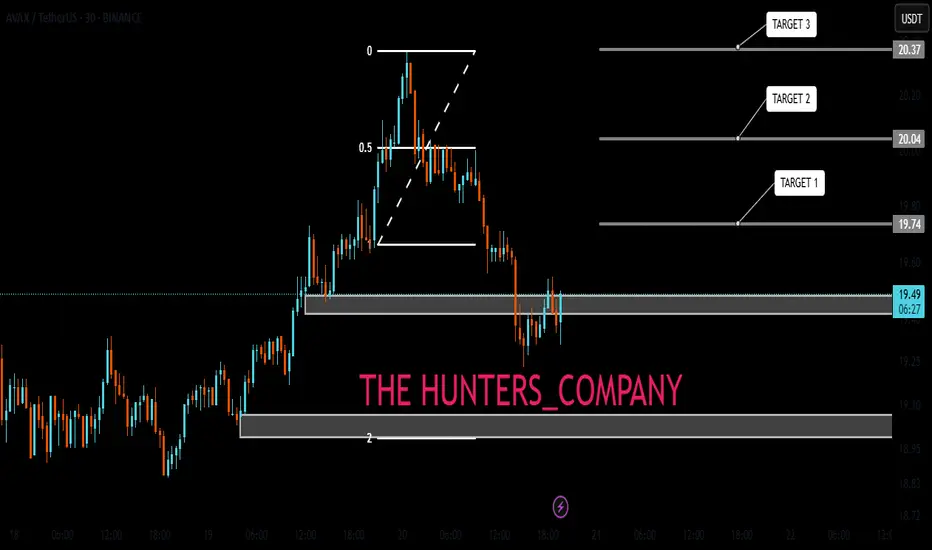
#AVAX/USDT#AVAX
The price is moving within a descending channel on the 1-hour frame and is expected to break and continue upward.
We have a trend to stabilize above the 100 moving average once again.
We have a downtrend on the RSI indicator that supports the upward move with a breakout.
We have a support area at the lower limit of the channel at 17.22, acting as strong support from which the price can rebound.
Entry price: 17.54
First target: 17.92
Second target: 18.22
Third target: 18.62

They want AVAX to look weak down here Everyone’s staring at the recent drop like it’s collapse. I see rotation into discount. AVAX is tagging the 0.786 retracement (17.27) — the same level that Smart Money builds into before it reclaims value.
Breakdown of the move:
The range top at 26.86 marked the premium; we’ve now delivered deep into the 0.786
No displacement through the previous swing low — yet
Structure remains intact if 14.66 holds — anything above that is deliberate discount rebalancing, not failure
This is where liquidity collects before decisions are made.
Execution lens:
Accumulation zone: 17.27–14.66
If bulls defend this pocket, 20.76 (0.5 fib) is the first draw, then 22.20
Final delivery window sits between 22.20–23.98 — where late buyers chase
AVAX doesn’t need a narrative. Price is the narrative.
Watch this base. And if it holds — don’t act surprised when it’s 20+.
For more setups that map where, not when — check the profile description.

Avalanche (AVAX) Price at Key Resistance – Potential Short Setup📉 AVAX/USDT – Possible Bearish Setup Developing 📉
Currently watching Avalanche (AVAX) paired with USDT 🔍, and price action is starting to show signs of bearish momentum creeping in.
We’ve seen a subtle shift to the downside, and I'm anticipating the potential for further weakness into the end of the week 📆🔻.
Here’s what I’m looking for:
🔹 A pullback into resistance — specifically the level highlighted in the video
🔹 A rejection and failure to break above that resistance zone
🔹 A bearish break of market structure following the rejection
If these conditions are met, I’ll be considering a short opportunity aligned with the developing trend 🔄📊.
🎯 As always, patience and precision are key — I’m not acting until price confirms the setup.
⚠️ Disclaimer: This is not financial advice. The content shared is for educational purposes only. Always conduct your own analysis and manage your risk appropriately.

AVAX About to Nuke Longs Before Pumping to $30?Yello Paradisers — are you prepared for the next major #AVAX move, or will you once again fall into the trap smart money is setting right now? The chart is screaming probable bullish continuation, but not before one final trick to flush out weak hands. We warned you before — and now the game is unfolding exactly as expected.
💎#AVAXUSDT has clearly broken market structure by forming a higher high, confirming a potential trend shift. However, price failed to close above the 25.82–26.93 resistance zone, leaving the bullish breakout unconfirmed. This hesitation right at a critical level increases the probability of a fakeout or liquidity sweep before any continuation.
💎Right now, we are hovering just above the ascending trendline, and based on current structure, the most probable scenario is a sweep of that trendline liquidity, grabbing stops from impatient longs before the market forms a clean higher low and reverses aggressively to the upside.
💎The green zone around 22.00–23.00, which previously acted as resistance, has now flipped to support. As long as price holds above this level, the bullish probability remains dominant. However, if we see a temporary dip below the trendline toward the 19.08 region, where support lies, that would likely be a classic liquidity hunt — designed to trigger fear, force early exits, and then reverse powerfully into the next leg.
💎And while both scenarios favor upside, it is the path of maximum frustration — likely a wick into 19.00 — that has historically proven most probable before larger breakouts.
💎A sustained move above the 26.93 level, especially on a daily candle close, would significantly increase the probability of continuation toward the major resistance between 30.00 and 30.74. This zone remains the main upside target in the short to mid-term.
💎On the other hand, if price closes below 16.67, that would invalidate this bullish outlook and open the door to deeper downside. Until then, structure remains bullish, and the higher-probability outcome still favors upside after a potential short-term shakeout.
This is the point where the weak hands get shaken out and smart money reloads, Paradisers. If you're aiming for long-term success, wait for high-probability setups and protect your capital. Strive for consistency, not quick profits. Treat the market as a businessman, not as a gambler.
MyCryptoParadise
iFeel the success🌴

$AVAX Update – Breakout Retest Play!!CRYPTOCAP:AVAX is respecting the ascending trendline beautifully after a clean retest of the breakout zone.
The price is holding above the trendline, and the 200 EMA is in the 4H timeframe.
Multiple confluences align around the $22.5–$23 zone – a critical support area now flipped from resistance.
Targets are set at:
• 26.81
• 29.47
• 33.40
As long as we hold this support, the upside potential remains strong.

AVAXUSDT 📊 BINANCE:AVAXUSDT Chart Analysis
AVAX price, after breaking the key resistance at 22.20, is showing a strong upward move 📈 toward the next resistance at the end of the second leg at 30.00 USD. The 22.00 level could act as a pullback and provide strong support 🔄. If it consolidates above 30.00, the uptrend may continue to 37.00 🚀.
Support and Resistance Levels:
Supports:
• 22.20 🛡️
• 20.00 🛡️
• 17.50 🛡️
Resistances :
• 30.00 🚧
• 37.00 🚧

AVAX Weekly Outlook – A Potential 558% Move Ahead?CRYPTOCAP:AVAX is coiling inside a massive multi-year symmetrical triangle on the weekly chart. This is a textbook structure where volatility contracts before an explosive move, and the setup looks nearly complete!
🔹 Entry Zone: Highlighted accumulation zone around CMP- $17
🔹 Breakout Target: If AVAX breaks out, we could see a move toward $147 (a whopping +550%)
🔹 Resistance to Watch: $45-$50 range – historical supply zone
🔹 Support: The Ascending trendline from 2021 continues to act as a strong base
Fundamentals Behind the Chart:
Avalanche (AVAX) is one of the fastest smart contract platforms in terms of time-to-finality. It supports Subnets (custom blockchains), which are gaining traction for scalable enterprise and gaming solutions. With growing DeFi and NFT adoption on Avalanche, fundamentals are aligning with this technical setup.
If this breakout holds, AVAX might become one of the best large-cap performers in the next cycle.

AVAX/USDT:BUYHello friends
Due to the price correction, we can buy in two designated areas in a stepwise manner. Elite with capital and risk management.
*Trade safely with us*
Avalanche (AVA): Overextended! Is This Ready for a Bullish Move?Avalanche (AVAX) is currently presenting an intriguing setup, with price action showing signs of being overextended on the daily and 4-hour timeframes. The cryptocurrency has recently traded into a critical support zone, defined by previous swing lows on the daily chart. This area has historically acted as a strong demand zone, attracting buyers. However, AVAX has now dipped below these lows, triggering sell-side liquidity in the form of stop-loss orders placed beneath this level. This liquidity grab could be a precursor to a potential bullish reversal. 🚀
On the 15-minute timeframe, AVAX is consolidating within a tight range, reflecting indecision among market participants. A break above this range, coupled with a bullish market structure shift, could signal the start of a reversal and provide a high-probability buy opportunity. This setup aligns with the concept of a "liquidity sweep," where price manipulates stop orders before reversing direction.
Key Observations:
Daily Timeframe: Price has dipped below key swing lows, eating into sell-side liquidity.
4-Hour Timeframe: Overextension is evident, with price trading into a significant support zone.
15-Minute Timeframe: Consolidation within a range, awaiting a breakout.
Trading Plan:
Wait for Confirmation: Monitor the 15-minute timeframe for a bullish breakout above the current range. 📈
Market Structure Shift: Look for higher highs and higher lows to confirm bullish intent. 🔍
Entry Strategy: Enter long positions after a confirmed breakout, with a stop-loss placed below the range low. 🛡️
Target Levels: Aim for resistance zones on the 4-hour and daily timeframes as potential take-profit areas. 🎯
Key Levels to Watch:
Support Zone: Previous daily swing lows (now acting as a liquidity zone).
Resistance Zone: The upper boundary of the 15-minute range and key levels on the 4-hour chart.
This setup highlights the importance of patience and discipline in trading. While the liquidity grab below support is a promising signal, confirmation of a bullish breakout is essential to avoid false moves. As always, this is not financial advice, and traders should conduct their own research before making any decisions. ⚠️

Avalanche AVAX Will Reach $100+ In 2025!Hello, Skyrexians!
Let's make an update on BINANCE:AVAXUSDT the coin with the most clear Elliott waves structure. We have some changes since our last update.
Let's take a look at the weekly chart. We can count the growth from the bottom to the March 2024 top as the wave 1. After that we can see the flat correction ABC in the wave 2. The great sign that price has printed even 2 green dots on the Bullish/Bearish Reversal Bar Indicator inside the Fibonacci 0.61 zone. We expect that for this asset correction is over and the next target is 1.61 extension for the wave 3. Now it's located at $105.
Best regards,
Skyrexio Team
___________________________________________________________
Please, boost this article and subscribe our page if you like analysis!

AVAX/USDT: BIG CHANCEHello friends
As the price reached a resistance area, we witnessed a double top pattern that caused the price to fall.
Now the price has been able to recover by reaching a strong support area and with the continued power of buyers, you can buy within the specified ranges and we have also specified targets for you.
*Trade safely with us*

Avalanche AVAX Is About To Make 10X!Hello, Skyrexians!
Today we have another one gem BINANCE:AVAXUSDT which has confirmed its strength and can make at least 10X in this bull run. Now we will explain why.
You can notice that the previous bull run was really huge, let's count it as an impulsive wave 1. The bear market retraced at 0.61 Fibonacci and found support there. Now this coin is in global wave 3. We thought earlier that wave 2 in this wave 3 has been finished already with the green dot at the Bullish/Bearish Reversal Bar Indicator , but price returned back to this level.
Nothing bad has happened this is still wave 2, but in shape of irregular ABC correction. From the current price we expect the move at least to $250 in 2025.
Best regards,
Skyrexio Team
___________________________________________________________
Please, boost this article and subscribe our page if you like analysis!

AVAX buy/long setup (8H)From the point we marked on the chart, it seems that AVAX has started its correction.
An ABC pattern is nearing completion. The green zone is a fresh support level.
In this area, we can look for buy setups to enter a new pattern or wave D.
A daily candle closing below the invalidation level will invalidate this analysis.
For risk management, please don't forget stop loss and capital management
Comment if you have any questions
Thank You

AVAX LongAvax bounced at 34.50, where there's strong support= EMA 200 on the daily chart. At the moment, we have broken the trendline and are currently testing prev week mid and monday mid also previous small rezistance.
If we manage to hold, I expect the price to shoot up to 38.96, and from there, I anticipate the price will go back to test the level of 37.68. If it holds, I’ll be opening a trade.
If you want you can buy now: TARGET - 38,90
SL- 37,09

AVAXUSDTBuilding Volume for a Potential Move
AVAX is showing strong accumulation signs, with increasing trading volume and steady price action. This indicates growing interest from buyers, potentially setting the stage for a significant breakout.
Key support levels are holding firm, suggesting that bulls are defending these zones effectively. If the volume continues to rise and breaks through key resistance levels, we could see a strong upward trend.

From $46 to Glory or Gloom – Avalanche AVAX JourneyAvalanche is trading at a crucial juncture near $49.08, with price action consolidating in range zone where we will continue to see slow and choppy price action.
1. A bounce from the support level at $46.09 and a subsequent push above $51.62 could signal bullish momentum for AVAX, paving the way for a rally toward the next resistance level at $59.39 (Dashed Green Projections).
2. A breakout beyond this zone would confirm strong buyer interest, potentially targeting higher levels near $66.63 as the next key milestone (Green Projections).
3. A failure to maintain the $46.09 support could open the door to further declines, with the price likely retesting the next major support at $38.32 (Red Projections).

AVAX's BIG RUNAvalanche’s recent price performance reflects a bullish trajectory, marked by a breakout from prolonged consolidation phases. The chart indicates two earlier periods of accumulation, where rounded bottoms were formed before subsequent strong breakouts. Each of these breakouts led to exponential price increases, with the latest move propelling AVAX’s price to its $50 target.
Support and Resistance Zones Identified:
The $10–$12 range served as a strong accumulation zone for AVAX during the earlier phases of consolidation. As the price gained momentum, the $25–$30 range emerged as a key resistance level.
This pattern showcases AVAX’s strong growth potential following each period of accumulation and breakout.

Explosive Opportunity AheadA key resistance level (marked in red) is currently being tested on $AVAX. If this resistance is broken, we could see a rapid rally, making this a critical point to monitor closely.
For those waiting to enter, the green line represents an ideal level to join the move after confirmation of the breakout. Both green boxes are excellent buying opportunities, but note that the second one may not be reached if momentum carries us upward quickly.
Key Notes:
Red Resistance Zone: Watch for a decisive breakout with strong volume.
Green Line Entry: Ideal spot to join post-breakout.
Green Boxes: Strong support zones; the first is more likely to hold.
Stay vigilant and ready to act, as a confirmed breakout could lead to significant upside movement in $AVAX.
I keep my charts clean and simple because I believe clarity leads to better decisions.
My approach is built on years of experience and a solid track record. I don’t claim to know it all, but I’m confident in my ability to spot high-probability setups.
My Previous Analysis
🐶 DOGEUSDT.P: Next Move
🎨 RENDERUSDT.P: Opportunity of the Month
💎 ETHUSDT.P: Where to Retrace
🟢 BNBUSDT.P: Potential Surge
📊 BTC Dominance: Reaction Zone
🌊 WAVESUSDT.P: Demand Zone Potential
🟣 UNIUSDT.P: Long-Term Trade
🔵 XRPUSDT.P: Entry Zones
🔗 LINKUSDT.P: Follow The River
📈 BTCUSDT.P: Two Key Demand Zones
🟩 POLUSDT: Bullish Momentum
🌟 PENDLEUSDT: Where Opportunity Meets Precision
🔥 BTCUSDT.P: Liquidation of Highly Leveraged Longs
🌊 SOLUSDT.P: SOL's Dip - Your Opportunity
🐸 1000PEPEUSDT.P: Prime Bounce Zone Unlocked
🚀 ETHUSDT.P: Set to Explode - Don't Miss This Game Changer
🤖 IQUSDT: Smart Plan

Avalanche (AVAX) - Ascedning Channel PatternChart shows trend lines ascending with Higher Highs on Resistance & Higher Lows with the Support recently of "$40" that still held for the bulls!🟢👀
Target= $46.90
