✅TS ❕ AVAXUSD: top again✅✅ AVAX is moving in the accumulation zone.
The main trend is downward, but the price is rising.
Growth is possible, but be careful.✅
🚀 BUY scenario : long to 14.74.🚀
----------------------------------------------------------------------------
Remember, there is no place for luck in trading - only strategy!
Thanks for the likes and comments.
AVAXUSD

AVAXUSD ❕ downward channelA bullish divergence was formed on the 4H Timeframe, confirmed by trading volumes.
The price is testing 50EMA as support (4H TF)
I expect the price growth after fixing in the channel.

✅TS ❕ AVAXUSD: into correction✅✅ AVAX went into correction.
The price rose above the support level.
Further growth is possible.✅
🚀 BUY scenario : long to 14.74.🚀
----------------------------------------------------------------------------
Remember, there is no place for luck in trading - only strategy!
Thanks for the likes and comments.

Avalanche (AVAX) - November 24Hello?
Traders, welcome.
If you "Follow", you can always get new information quickly.
Please also click "Boost".
Have a good day.
-------------------------------------
(AVAXBTC 1W Chart)
In order to get the power to rise, it must be supported in the range of 0.0007 164 to 0.0009 769.
---------------------------------------
(AVAXUSDT 1W Chart)
The 15.44-20.30 interval is the one that determines the trend.
Therefore, it is important to be supported by rising to the 15.44-20.30 section.
However, the 13.47 point is the volume profile section, and if resistance is received at 13.47, there is a possibility of falling to around 6.54, so you need to think about countermeasures.
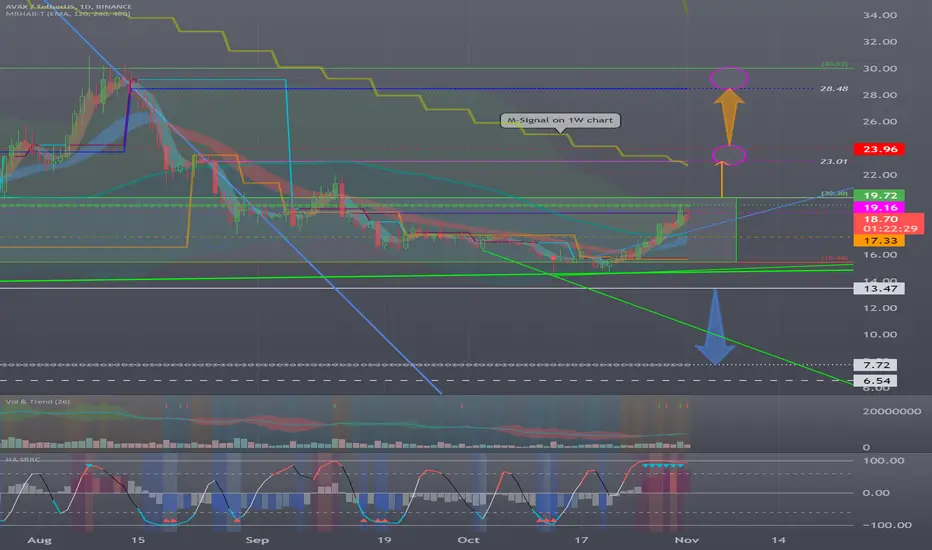
(1D chart)
It will be important if the price can quickly rise above 13.47 and sustain the price.
If this is not the case, it may lead to further declines, so cautious trading is required.
-------------------------------------------------- -------------------------------------------
** All descriptions are for reference only and do not guarantee profit or loss in investment.
** If you share this chart, you can use the indicators normally.
** The MRHAB-T indicator includes indicators that indicate points of support and resistance.
** SR_R_C indicators are displayed as StochRSI (line), RSI (columns), and CCI (bgcolor).
** The CCI indicator is displayed in the overbought section (CCI > +100) and oversold section (CCI < -100).
(Short-term Stop Loss can be said to be a point where profit or loss can be preserved or additional entry can be made by split trading. This is a short-term investment perspective.)
---------------------------------

Technical analysis of AVAXPrice is moving down respecting a resistance line I expect price to reach the 3h demand zone around $12.3 before moving up again from there towards the 3h supply at $13.6.

✅TS ❕ AVAXUSD: support level.✅✅ AVAX has reached the support level.
The price has already rebounded.
I expect growth.✅
🚀 BUY scenario : long to 14.74.🚀
----------------------------------------------------------------------------
Remember, there is no place for luck in trading - only strategy!
Thanks for the likes and comments.

AVAXUSDT planpossible double bottom forming but that basically depends on BTC... still has a long way to go though, claim 13.5 claim 4H trend.

✅TS ❕ AVAXUSD: goes even lower✅✅ AVAX has reached the support level.
The price goes even lower, forming a breakdown, possibly false.
I expect growth.✅
🚀 BUY scenario : long to 14.74.🚀
----------------------------------------------------------------------------
Remember, there is no place for luck in trading - only strategy!
Thanks for the likes and comments.

AVAX technical analysisPrice bounced off a weekly demand zone where it then got rejected off the resistance at $15.6. I expect price to trade deeper into the weekly demand zone. Before potentially moving up again

Avalanche (AVAX) - November 10Hello?
Welcome, traders.
By "following", you can always get new information quickly.
Please also click "Boost".
Have a good day.
-------------------------------------
(AVAXBTC 1W Chart)
The key is whether the 0.007164-0.009769 zone can support and move up.
If the price holds above 0.009187, it is expected to dissipate strength.
-----------------------------------------
(AVAXUSDT 1W Chart)
The key is whether it can be supported by rising to the 15.44-20.30 section.
To do that, we need to see if it can rise above 13.47.
(1D chart)
The key is whether it can rise above 13.47 and find support.
If it doesn't, there is a possibility that it will move towards the 7.72 area, so be careful.
------------------------------------------------------------ -------------------------------------------
** All descriptions are for reference only and do not guarantee a profit or loss in investment.
** If you share this chart, you can use the indicators normally.
** The MRHAB-T indicator contains indicators that indicate support and resistance points.
** SR_R_C indicators are displayed as StochRSI(line), RSI(columns), CCI(bgcolor).
** CCI indicator is expressed as overbought range (CCI > +100) and oversold range (CCI < -100).
(Short-term Stop Loss can be said to be a point where profit and loss can be preserved or additional entry can be made through split trading. It is a short-term investment perspective.)
---------------------------------

✅TS ❕ AVAXUSD: downward impulse✅✅ AVAX made a downward impulse.
The price stopped at the support level.
Correction is possible.✅
🚀 BUY scenario : long to 17.75.🚀
----------------------------------------------------------------------------
Remember, there is no place for luck in trading - only strategy!
Thanks for the likes and comments.

AVAX - Similar Double Bottoms AVAX has printed a nice double bottom which is very comparable to a past double bottom that saw great bullish results
A double bottom is a bullish reversal pattern
Bull opportunity

AVAXUSD -possible longHello fellow traders,
Referring to the chart above, price has close above the downward trendline suggesting that price might rally to the supply zone (drawn on the chart). If price does close above this zone, there's a possible chance that price might start to rally to the next zone.
however, if price does close below the weekly supply zone , there's a possible chance that price might retrace back to the weekly demand zone.
note: This is just our thoughts and opinion based on technical analysis that we see. This article is not a trading or financial advised. Kindly do your own research and risk what you can afford.
blessed trading everyone.
Cheers.

Avax breakout is realBroke out of a longterm c-fork, first target is top of the descending channel. Breakout of the channel has a measured move to $22.
RSI has bullish divergence.

Avalanche (AVAX) - November 2Hello?
Welcome, traders.
By "following", you can always get new information quickly.
Please also click "Boost".
Have a good day.
-------------------------------------
(AVAXUSDT 1W Chart)
The key is whether the 15.44-20.30 zone can support and rise.
(1D chart)
If it rises above 20.30, it is expected to move towards 23.96.
For this uptrend to continue, the price must remain above the M-Signal line on the 1W chart.
The HA-Low indicator on the 1W chart was formed at the 17.33 point, so if it goes down, the key is whether the price can sustain above 17.33.
------------------------------------------------------------ -------------------------------------------
** All descriptions are for reference only and do not guarantee a profit or loss in investment.
** If you share this chart, you can use the indicators normally.
** The MRHAB-T indicator contains indicators that indicate support and resistance points.
** SR_R_C indicators are displayed as StochRSI(line), RSI(columns), CCI(bgcolor).
** CCI indicator is expressed as overbought range (CCI > +100) and oversold range (CCI < -100).
(Short-term Stop Loss can be said to be a point where profit and loss can be preserved or additional entry can be made through split trading. It is a short-term investment perspective.)
---------------------------------
AVAXUSD ❕ broke up the downtrendAVAX continues to move above liquidity.
RSI chart is in the buy zone (4H, 1H and 30m TFs)
I think the asset may rise after fixing above the indicated resistance.

✅AVAX TARGETS AND BREAKOUT VIEW - BACK TO 100 USD!✅AVAX TARGETS
Since we expect a Bull trend on BTC, this is AVAX start target and bull trend target.
It shows the possibility of to increase in short term.
Since it has a high chance of a breakout.
This coin is known also as a whale-holding coin for DCA.
The first target is between 34-36 USD
high bull trend target between 92 USD and 100 USD
There is a high chance we have already done the bottom.
This is not trading advice, this trading idea is based on the cycle of AVAX.

AVAXUSDT Multiple bullish break-outs call for a higher target!*** ***
For this particular analysis on Avalanche we are using the AVAXUSDT symbol on the OKX exchange.
*** ***
The idea is on the 1D time-frame where AVAX recently broke above its 1D MA50 (blue trend-line), following an additional bullish break above the Lower Highs trend-line that started with the April 02 High. With the RSI on the 1W time-frame still on oversold territory, this is a major bullish signal on Avalanche on multiple break-outs.
The last time we had a break above the 1D MA50 on an oversold state, was on July 26 2021 and the huge rally of August - November started. The short-term target is the 1D MA200 (orange trend-line) and then the top (Higher Highs trend-line) of the Channel Up that started in June.
-------------------------------------------------------------------------------
** Please LIKE 👍, SUBSCRIBE ✅, SHARE 🙌 and COMMENT ✍ if you enjoy this idea! Also share your ideas and charts in the comments section below! This is best way to keep it relevant, support me, keep the content here free and allow the idea to reach as many people as possible. **
-------------------------------------------------------------------------------
You may also TELL ME 🙋♀️🙋♂️ in the comments section which symbol you want me to analyze next and on which time-frame. The one with the most posts will be published tomorrow! 👏🎁
-------------------------------------------------------------------------------
👇 👇 👇 👇 👇 👇
💸💸💸💸💸💸
👇 👇 👇 👇 👇 👇

✅TS ❕ AVAXUSD: bounced off✅AVAX is moving in the area of the resistance level.
A false breakdown occurred.
I expect a fall.
🚀 SELL scenario : short to 16.44.🚀
----------------------------------------------------------------------------
Remember, there is no place for luck in trading - only strategy!
Thanks for the likes and comments.

AVAX Long SetupHello, dear traders. how are you ? Today we have a setup to buy/long the AVAX symbol.
For risk management, please don't forget stop loss and capital management
When we reach the first target, save some profit and then change the stop to entry
Comment if you have any questions
Thank You

Avalanche (AVAX) - October 26Hello?
Welcome, traders.
By "following", you can always get new information quickly.
Please also click "Boost".
Have a good day.
-------------------------------------
(AVAXUSDT 1W Chart)
The key is whether the 15.44-20.30 zone is supported and able to rise.
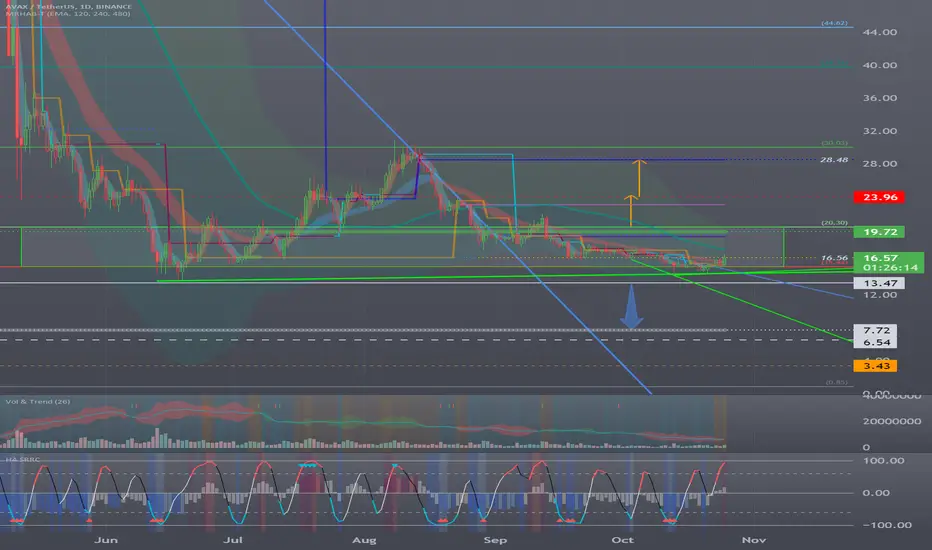
(1D chart)
The interval 15.44-20.30 is the interval that determines the trend.
If it falls below 13.47, it is likely to move towards 7.72.
Therefore, it is necessary to sell to secure cash.
If support is found above 16.56, it is expected to lead to a move towards moving above 19.72.
However, given the current price, it needs to rise above 28.48 to continue the uptrend.
------------------------------------------------------------ -------------------------------------------
** All descriptions are for reference only and do not guarantee a profit or loss in investment.
** If you share this chart, you can use the indicators normally.
** The MRHAB-T indicator contains indicators that indicate support and resistance points.
** HA SRRC indicators are expressed as StochRSI(line), RSI(columns), CCI(bgcolor).
** CCI indicator is expressed as overbought range (CCI > +100) and oversold range (CCI < -100).
(Short-term Stop Loss can be said to be a point where profit and loss can be preserved or additional entry can be made through split trading. It is a short-term investment perspective.)
---------------------------------
Avaxusdt Dont forget to buy avax for the long term
one of the best projects
hope for the best for all

✅TS ❕ AVAXUSD: bounced back✅✅ AVAX bounced back from the support level.
The price has already bounced up several times.
I expect growth.✅
🚀 BUY scenario: long until 16.44.🚀
----------------------------------------------------------------------------
Remember, there is no place for luck in trading - only strategy!
Thanks for the likes and comments.
