Avax Bouncing off SupportShort term long position targets at .5 and .618 fib levels we have a “W” formation at the support with confirmation from retest, sloploss below support
AVAXUSD

✅TS ❕ AVAXUSD: double bottom✅✅AVAX moves sideways. The price has reached the resistance level and the support level several times. Now the price is moving in the support area. I expect growth.✅
🚀 BUY scenario: long to 20.🚀
----------------------------------------------------------------------------
Remember, there is no place for luck in trading - only strategy!
Thanks for the likes and comments.

AVAXUSDT | Wave Projection | Bullish Wedge Ending DiagonalPrice action and chart pattern trading setup
> Elliott Wave analysis possible 2-wave ending diagonal pattern with bullish momentum - a potential falling wedge breakout scenario
> Entry @ 2-wave bullish wedge breakout and EMA10 TF24H
> Target @ upper downtrend line resistance 0.618 - 0.786 retracement of 1-wave zone + 30- 40%
> Stop @ the lowest 2-wave position -10%
> Risk reward ratio: 2:1 / 3:1
Indicator:
>RSI bullish momentum about to cross MA line
>MACD bullish momentum just below signal line
Always trade with affordable risk and respect your stop
✅TS ❕ AVAXUSD: double top✅✅AVAX has formed a double top near the support level. The price has already started to rise. I expect continued growth.✅
🚀 BUY scenario: long to 22.84.🚀
----------------------------------------------------------------------------
Remember, there is no place for luck in trading - only strategy!
Thanks for the likes and comments.

Trading opportunity for AVAXUSDT AvalancheBased on technical factors there is a Long position in :
📊 AVAXUSDT Avalanche
🔵 Long Now or by Breakout
🧯 Stop loss 16.91
🏹 Target 1 23.50
🏹 Target 2 27.20
💸Capital : 1%
We hope it is profitable for you ❤️
Please support our activity with your likes👍 and comments📝

Avalanche (AVAX) - September 1Hello?
Welcome, traders.
By "following", you can always get new information quickly.
Please also click "Like".
Have a good day.
-------------------------------------
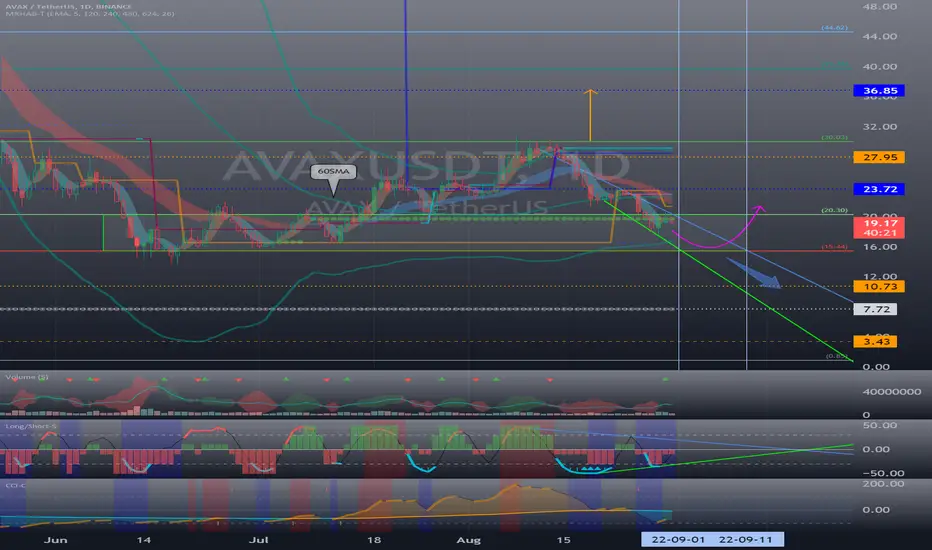
(AVAXUSDT 1W Chart)
The key is whether the 15.44-20.30 zone is supported and able to rise.
(1D chart)
To get out of the downtrend channel, we need to see if we can find support in the 15.44-20.30 zone.
In particular, you need to make sure that the price remains above 20.30 after around the 9th or 11th.
If they can't get out of the bearish channel, they could move towards the 7.72-10.73 section.
------------------------------------------------------------ -------------------------------------------
** All descriptions are for reference only and do not guarantee a profit or loss in investment.
** The MRHAB-T indicator, which is inactive on the chart, contains indicators that indicate support and resistance points.
** Background color of Long/Short-S indicator: RSI oversold and overbought sections
** Background color of CCI-C indicator: When the short-term CCI line is below -100 and above +100, oversold and overbought sections are displayed.
** The OBV indicator was re-created by applying a formula to the DepthHouse Trading indicator, an indicator disclosed by oh92. (Thanks for this.)
(Short-term Stop Loss can be said to be a point where profit and loss can be preserved or additional entry through split trading. It is a short-term investment perspective.)
---------------------------------
AVAXUSDTNow is not the time to be buying Alts.
Patience is key. Total Market Cap is rolling over. Im expecting a fud storm so that the new institutional entrants to crypto can get a large position at MUCH lower prices. I will start my DCA campaign on AVAX when we get back to single digits. very unpopular TA with AVAX lovers but I intend on getting myself a nice bag at lower prices. I want to see an accumulation range and a nice W bottom on a weekly chart.
Im not overly bearish at these levels but not bullish either. Now is not the time to be Bearish. Hope everyone has some dry powder for when the opportunity presents itself.

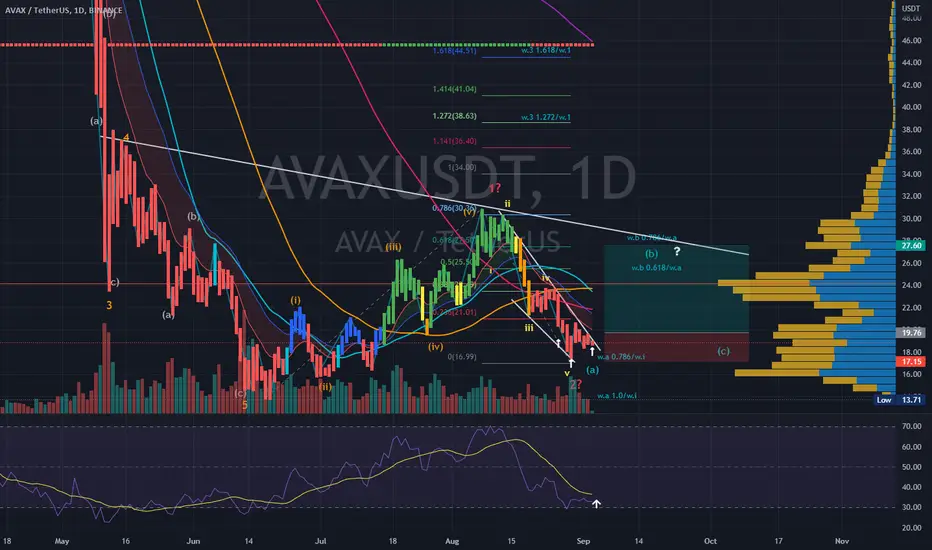
Roadmap for AvalancheFrom the swing low, we have made what appears to be 5 waves up.
Looking for the completing of the 5th wave down on this local trend to end around 19.80s before we see a bounce.
Ultimately looking for a major bounce at 16$ at AVAX's favourite fib level.

✅TS ❕ AVAXUSD: corrective sideways✅AVAX is moving in a corrective sideways. The price has not increased much and this indicates the strength of the downward movement. I expect a fall.
🚀 SELL scenario : short to 19.🚀
----------------------------------------------------------------------------
Remember, there is no place for luck in trading - only strategy!
Thanks for the likes and comments.

AVAXUSDT has formed a Bullish pattern at the support zoneAVAXUSDT has formed a Bullish pattern at the support zone. The price was not able to break below the support zone. we can expect that the price goes up after the consolidation.
💎 AVAXUSDT
🔵 Entry zone 22.47- 23.72
🟢 TP1 25.36
🟢 TP2 29.26
🟢 TP3 34.79
🔴 SL 20.23
Good Luck 🎲

Avaxusdt - strong growth 669 days reversal nowNow we can reversal because 699 days and we dont have strong resistance from 22$ To 26.75$.

Avalanche (AVAX) - August 20Hello?
Welcome, traders.
If you "follow", you can always get new information quickly.
Please also click "Like".
Have a good day.
-------------------------------------
(AVAXUSDT 1W Chart)
The key is whether you can keep the price above 20.30.
(1D chart)
The key is whether it can move higher than 23.72.
Otherwise, it is expected to decline to the 15.44-20.30 section.
A move above 23.72 is expected to lead to an attempt to move above 30.03.
- The RSI indicator, the Stoch RSI indicator, and the CCI indicator are all in the oversold zone.
So, it's a good idea to check the movement until you start breaking out of the oversold zone.
- Aggressive buying is currently possible, but if you are unfamiliar with short-term trading, it is not recommended to challenge it.
------------------------------------------------------------ -------------------------------------------
** All descriptions are for reference only and do not guarantee a profit or loss in investment.
** The MRHAB-T indicator, which is inactive on the chart, contains indicators that indicate support and resistance points.
** Background color of Long/Short-S indicator: RSI oversold and overbought sections
** Background color of CCI-C indicator: When the short-term CCI line is below -100 and above +100, oversold and overbought sections are displayed.
** The OBV indicator was re-created by applying a formula to the DepthHouse Trading indicator, an indicator disclosed by oh92. (Thanks for this.)
(Short-term Stop Loss can be said to be a point where profit and loss can be preserved or additional entry can be made through split trading. It is a short-term investment perspective.)
---------------------------------

short it all to zero | $avax to $22exited all longs with this pump. was mainly in eth as wee moved avax long profits to eth a few days ago.
don't think avax takes out the high. was the final momentum pump we were looking for.
next two weeks or so expecting all downside action.
just about everything should be a safe short from here.

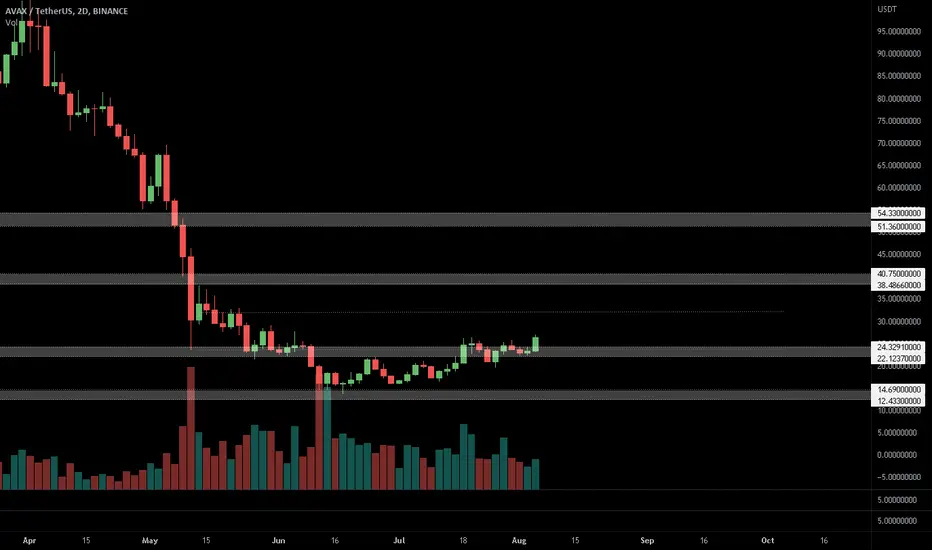
Avalanche: The Very Hungry Caterpillar 🐛You know the children’s book The Very Hungry Caterpillar by Eric Carle? Just like the story’s protagonist, Avalanche is crawling around with wriggly movements and is repeatedly gnawing at the turquoise zone between $25.29 and $39.63. If the altcoin wants to further our primary scenario, though, it should pupate soon and emerge as a beautiful butterfly, flapping away above the resistance at $103.64. However, there is also a chance that Avalanche could lose its footing and drop below the resistance at $9.25, which would then elicit a strong downwards spiral.


✅TS ❕ AVAXUSD: three peaks✅✅AVAX has formed three peaks at the resistance level. After that, the price went down sharply. I expect the fall to continue.✅
🚀 SELL scenario: short to 19.🚀
----------------------------------------------------------------------------
Remember, there is no place for luck in trading - only strategy!
Thanks for the likes and comments.

✅TS ❕ AVAXUSD: bounced off✅✅AVAX bounced off the resistance level several times. The price has changed the trend and is falling after the last bounce. It is possible to fall to the support level.✅
🚀 SELL scenario: short to 25.47.🚀
----------------------------------------------------------------------------
Remember, there is no place for luck in trading - only strategy!
Thanks for the likes and comments.

AVAX TREND UNDER THREAT?AVAX 1D: Bearish flag brewing as illustrated between the white regression lines. Also note the declining volume against rising price as shown along the bottom of the chart. Strong price architecture is built on a solid volume foundation. That foundation looks to be waning.
A downside breach of the 24.17 level, which is (-2 ) standard deviations off the linear mean, would potentially put the recent upward trend under threat.
The RSI has touched the overbought level at the top end of its range on the 1 day time frame and begun trending downward. Trips over 70 on larger timeframes such as the 1 day chart are significant indications of a rally potentially coming to its end. Stay nimble out there.

✅TS ❕ AVAXUSD: double top✅✅AVAX forms a double top at the resistance level. This signal may mean an imminent reversal. I expect a fall.✅
🚀 SELL scenario: short to 25.47.🚀
----------------------------------------------------------------------------
Remember, there is no place for luck in trading - only strategy!
Thanks for the likes and comments.

AVAXUSD ❕ overboughtAVAX is moving above the uptrend channel.
The asset is overbought by the BB indicator (4H TF) and RSI (1H TF)
I expect AVAX may decline if price holds below the upper boundary of the uptrend channel.
#AVAX, Could be up to something 🤔#AVAX
Could be up to something 🤔
Highest value since May while UCTS printed a 2D Buy
setting some alerts just in case volume starts getting momentum toward 30$+
$avax target remains $28-30should have stuck with this game plan as avax bounce right at our w4 completion zone.
still targeting $28-30 minimum.
only area i'm concerned about is the ? white box. rejection there would signal another wave down and likely the end of this bull run.
until then, long your longs.
avax vs eth for additional context. think avax outperforms again:

$avax longplaying this level by level. currently holding above wave 1, which is what we'd like to see for a wave 4, with wave 5 coming up.
marked this green box last week as potential support.
looks to be holding.
wave 5 should put us around $28.
