Trading opportunity in AVAXUSDTBased on technical factors there is a long position in :
📊 AVAXUSDT-Avalanche
🔵 Long Now 31.50
🧯 Stop loss 22.80
🏹 Target 1 38.00
🏹 Target 2 47.47
🏹 Target 3 65.00
💸Capital : 1%
We hope it is profitable for you ❤️
Please support our activity with your likes👍 and comments📝
AVAXUSD

TS ❕ AVAXUSD: support levelAVAX has reached the support level. I expect an upward rebound.
BUY scenario: long to 37.
----------------------------------------------------------------------------
Remember, there is no place for luck in trading - only strategy!
Thanks for the likes and comments.

AVAXUSD hit the Channel Up bottom. Levels to watch.Avalanche (AVAXUSD) hit on May 12 the bottom (Higher Lows trend-line) of the Channel Up that started after its February 10 2021 High. That was its first High and May 12 marked its second Higher Lows. Assuming that holds, the pattern will continue to hold and we will have to look for specific markers in order to time a new uptrend.
As you see, there are three indicators that broke in a specific order during the last rise to a Higher High. First the price broke above the 1D MA50 (blue trend-line) following the Higher Low consolidation. Then the RSI on the 1W time-frame crossed above its MA. Finally the 1W MACD made a Bullish Cross. Keep an eye on those conditions and plan a potential buy strategy accordingly.
On the other hand, a weekly (1W) candle closing below the Higher Lows trend-line of the Channel Up, can set in motion the lower Fibonacci extensions, namely the -0.236 and -0.382 before the market bottoms out.
--------------------------------------------------------------------------------------------------------
Please like, subscribe and share your ideas and charts with the community!
--------------------------------------------------------------------------------------------------------

Avalanche (AVAX) - May 19hello?
Traders, welcome.
If you "follow", you can always get new information quickly.
Please also click "Like".
Have a nice day.
-------------------------------------
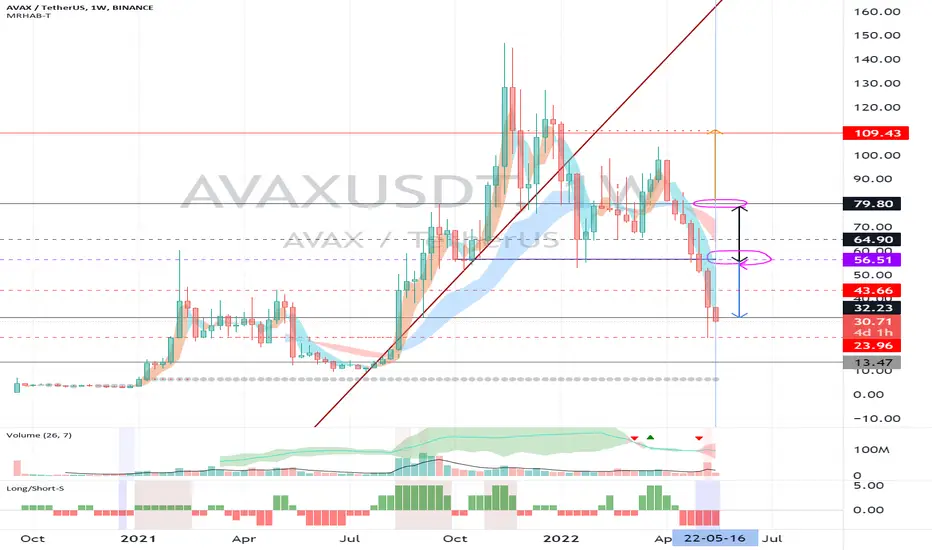
(AVAXUSDT 1W Chart)
As it fell below 32.23, the possibility of entering the mid- to long-term investment sector is increasing.
Therefore, it is important to see if it rises above 32.23.
------------------------------------------------------------ -----------------------------------------------------
** All indicators are lagging indicators.
Therefore, it is important to be aware that the indicator will move accordingly as price and volume move.
However, for convenience, we are talking in reverse for the interpretation of the indicator.
** The MRHAB-T indicator used in the chart is an indicator of our channel that has not been released yet.
** The OBV indicator was re-created by applying a formula to the DepthHouse Trading indicator, an indicator disclosed by oh92. (Thanks for this.)
** Support or resistance is based on the closing price of the 1D chart.
** All descriptions are for reference only and do not guarantee a profit or loss in investment.
(Short-term Stop Loss can be said to be a point where profit and loss can be preserved or additional entry can be made through split trading. It is a short-term investment perspective.)
---------------------------------
Bullish rebound to continue falling.The Momentum with a positive slope (dark red) is showing me the beginning of an upward movement and the ADX with a negative slope indicates the loss of strength of the downward movement.
The possible area of interest are the values between 60 (EMA 55) and 68 (POC - Point of Control), these values will change over time, and you should also be attentive to the movement of Bitcoin.

AVAXUSD ❕ price over liquidityAfter exiting the downtrend channel, AVAX formed an uptrend line while moving in the liquidity zone.
The price broke up through the 50, 100 and 200MAs on the 30m Timeframe.
I expect that after fixing above the support level, the price may continue to rise.
It's worth paying attention to volume growth because price just broke above the level.

AVAXUSDT | AB = CDAVAX is making a good short setup as harmonics AB=CD is in making.
Recently price has broken down the support and trading below it. One can remain sell on strength as with managed risk.


AVAXUSD ❕ WAVES ScenarioContinuing the movement in the descending channel AVAX broke up 50MA at 30m Timeframe and tested the lower boundary of the channel.
The current behavior of the volumes is similar to how the volumes of trades on WAVES, which we reviewed in a recent idea.
In case the price fixes above the lower boundary of the channel, I expect a bounce to the resistance level.

AVAXNot financial advice.
The essence of investing & trading is the intelligent and patient preying on the greed, fear, impatience, addiction and ignorance of the majority. It's definitionally Darwinian.

AVAXNot financial advice.
The essence of investing & trading is the intelligent and patient preying on the greed, fear, impatience, addiction and ignorance of the majority. It's definitionally Darwinian.
AVAX HAS BEEN TRADING WITHIN A DESCENDING CHANNEL. This asset has lost 2/3 of it peak value. But, is the fall in value over.
I hope we all learnt from this asset that FEAR OF MISSING OUT IS BAD. However, I am bullish LONGTERM.
SHARE YOUR THOUGHT, like, comment and follow

Avax Long positionAvax 1 D timeframe chart is showing signs of momentum and strengh. Great opportunity to go long on avax.
-Rsi bullish divergence;
-Volume decreasing;
-Geting close to a huge support zone.

AVAX Retest long signalNice to meet you, everyone
I'm an alt trader
I'm analyzing and recommending things that are similar to my personality among many alt coins
If the last support line is broken, say goodbye

AVAX could be getting ready too?Hello traders,
Back in the 'bullish days' last year AVAX did an incredible job. Project itself is interesting, seems to me like an upgraded competitor with DOT. However interest that AVAX had back then was quite suprising. It is correcting so far, but I'd expect 75-90$ region soon (when we reach diagonal ressistance) if it breaks I wouldn't be suprised at all with 200-250$ topping.
If you like my ideas, please consider following me on Tradingview and twitter, it would help me a lot.
Do your own reasearch and learning,
Trade safe, TradingInformator!

AVAXUSD ❕ another liquidity zone50MA and 100MA crossed upwards of 200MA at the 30m Timeframe.
After reaching the liquidity zone, the price began a correction on declining volumes.
I expect that after fixing above the support level, the price will again move towards the resistance level.

Avalanche (AVAX) - May 5hello?
Traders, welcome.
If you "follow", you can always get new information quickly.
Please also click "Like".
Have a nice day.
-------------------------------------
(AVAXUSDT 1W Chart)
56.51 or higher: Expected to create a new wave.
(1D chart)
It needs to move above 70.11 to turn into an uptrend.
So, if possible, it's a good idea to see support in 70.11.
(buy)
- After confirming the support in 70.11
(Stop Loss)
- When it is resisted by falling below 64.90
- When it falls below 56.51
(Sell)
- When resistance is received in the range 79.80-89.59
- When receiving resistance near 109.43
(buy)
- After confirming the support at 64.90
(Stop Loss)
- When it falls below 56.51
(Sell)
- When receiving resistance near 70.11
- When resistance is received in the range 79.80-89.59
- When receiving resistance near 109.43
A move above 89.59 is expected to trigger a sharp move.
A break below 56.51 is expected to turn into a downtrend.
------------------------------------------------------------ -----------------------------------------------------
** All indicators are lagging indicators.
Therefore, it is important to be aware that the indicator will move accordingly as price and volume move.
However, for convenience, we are talking in reverse for the interpretation of the indicator.
** The MRHAB-T indicator used in the chart is an indicator of our channel that has not been released yet.
** The OBV indicator was re-created by applying a formula to the DepthHouse Trading indicator, an indicator disclosed by oh92. (Thanks for this.)
** Support or resistance is based on the closing price of the 1D chart.
** All descriptions are for reference only and do not guarantee a profit or loss in investment.
(Short-term Stop Loss can be said to be a point where profit and loss can be preserved or additional entry can be made through split trading. It is a short-term investment perspective.)
---------------------------------

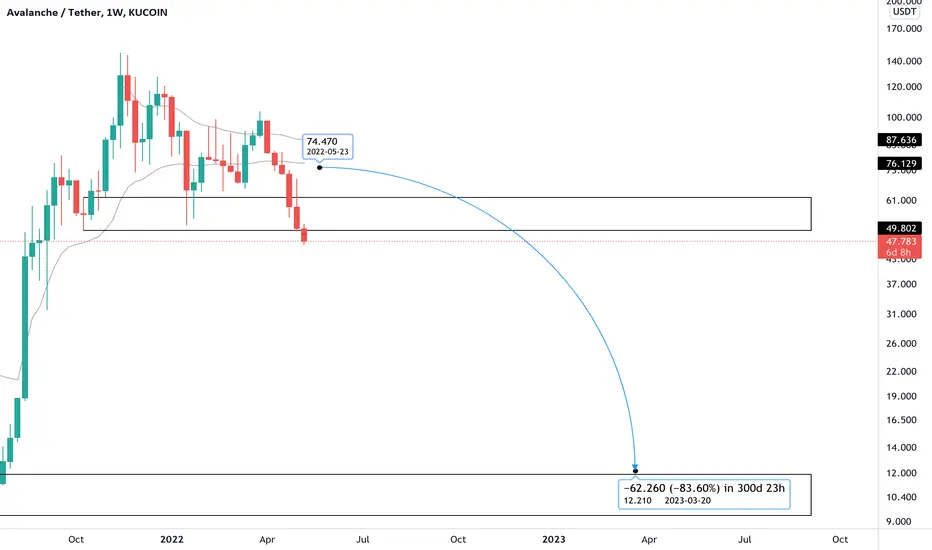
AVAX: Demand ZoneAVAX is about 60% down from the all time high in November. Currently, there is strong support between $46 to $60. This demand zone must hold and bounce above the main trend line for another bullish run up.

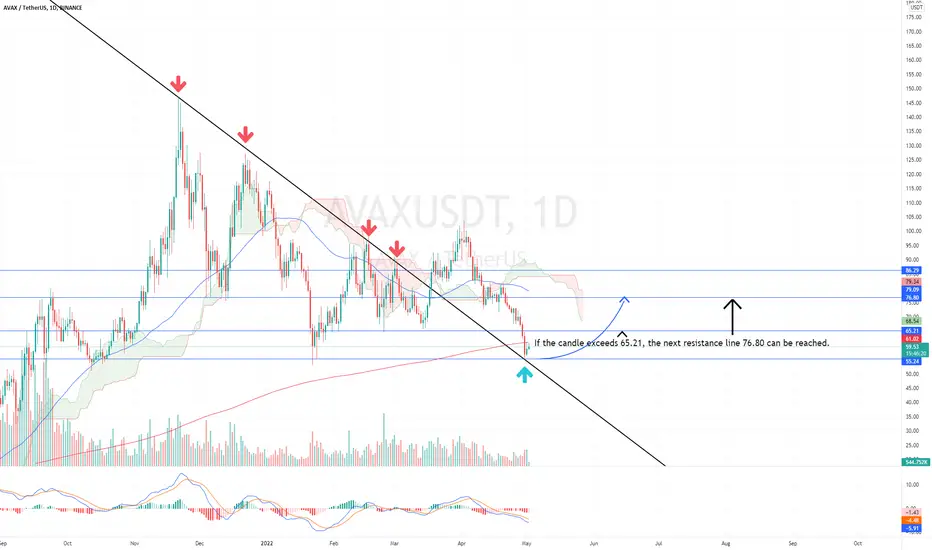
AVAX CRYPTO LONG SIGNALNice to meet you, everyone
I'm an alt trader
I am a South Korean soldier
I'm analyzing and recommending things that are similar to my personality among many alt coins
If the candle exceeds 65.21, the next resistance line 76.80 can be reached.
AVAXNot financial advice.
The essence of investing & trading is the intelligent and patient preying on the greed, fear, impatience, addiction and ignorance of the majority. It's definitionally Darwinian.

avalanche 🔺avax looks ripe for a rip,
after this last dip.
68ish is where i'd be interested to pick some up for a swing.
ride it up to 120+ before letting it go.
move could happen quite quickly, gotta have fast hands 💰

AVAX/USDT $500 ( 1500% ) Target in 2023 As per My Chart#AVAX/USDT Bullish chart Update:-
= $AVAX currently trading at $66
= Highly Potential to hit $500
= 2000% Up after first Accumulation zone.
= 1500% Up from 2nd accumulation zone.
= 1000% Expecting from the next Accumulation zone.
= The next Accumulation zone will be $35-$40
= Red Box RSI is the Perfect Entry zone.
= Expecting RSI will hit 30
= This time Breakout did but the Waiting for Retest level which is near $40
= Target will be $400+
Guys $AVAX is a Strong potential Project for Long Term.
I am accumulating at every Big Dip.
Please LIKE and Appreciate my Hard work.
Must follow me for the Latest real Time crypto Updates.
Thank you.

AVAXUSDT SETUPAVAXUSDT price hitting the confluence zone where EMA 400 + Fib golden level support and a trendline retest available. Bulls need to retain that level and will do some accumulation and surge up. Otherwise, bears can continue their dominance and will drag toward the next level.
