AVAX/USDT Break the descending channel, Ready for continue up??💎 AVAX's market behavior has recently displayed remarkable dynamism. Currently, AVAX has made a notable breakout from its descending channel pattern and is in the midst of a retesting phase at a pivotal support level. This phase is crucial for AVAX to validate its breakout and continue its ascent towards a significant resistance target.
💎 However, if AVAX struggles during the retesting phase at the support level, exhibiting signs of failure or breakdown, it may indicate a false breakout. This scenario could potentially lead AVAX to revisit the demand area around 31.3, a critical juncture for determining its future trajectory.
💎 Historically, AVAX has demonstrated a strong rebound when reaching the demand zone, suggesting a similar potential response in the current context.
💎 Nonetheless, a lackluster reaction or inability to hold the demand zone could signal bearish trends, possibly leading to a breakdown of this area. Should this occur, AVAX's next directional move could be towards the Bullish OB area, marking a key area for future market movements.
AVAXUSDT

AVAX → Avalanche At Resistance! Reversal Time? Let's Answer.Avalanche had one more nudge toward the 2021/2022 resistance level since my last analysis, creating a bearish divergence and setting us up for a short trade. Should we short now?
How do we trade this? 🤔
As stated in my last analysis and this one, we need a short signal and confirmation for justification to short AVAX. Our proposed third push up from the previous analysis never rendered a sell signal and has now created a bearish divergence with the RSI. This means the price had a higher high and the RSI a lower high, signaling weakening bulls.
This does *not* mean we enter a short now, it's too risky without more price action. We need a strong sell signal and preferably, a break below the channel support and a re-test for resistance. Then short down to the Daily 200EMA at a 1:2 Risk Reward Ratio. It's also reasonable to take half profits at a 1:1 Risk Reward (around $28.00) and swing the remainder at a 1:3 risk reward or until a reversal signal shows itself.
💡 Trade Idea 💡
Short Entry: $34.00
🟥 Stop Loss: $25.00
✅ Take Profit: $40.00
⚖️ Risk/Reward Ratio: 1:2
🔑 Key Takeaways 🔑
1. Bull Channel, Bias to Long!
2. Three Pushes up in Trend with Sell signal, Signal to Change Trend.
3. Gap to Second Push Support Line.
4. RSI at 63.00 and below Moving Average, Divergence.
5. Wait for Short Confirmation bar before entering a position.
💰 Trading Tip 💰
Divergences between price action and the RSI are not strong signals on their own. Combined with three pushes up in a trend, a major resistance area, and a sell signal, renders a higher probability of profit for reversal trading.
⚠️ Risk Warning! ⚠️
Past performance is not necessarily indicative of future results. You are solely responsible for your trades. Trade at your own risk!
Like 👍 and comment if you found this analysis useful!

#AVAXDue to the formation of a descending structure in the lower times H1-H4, we see lower floors and ceilings and a corrective formic. Therefore, if the stabilization candle is not recorded above $37.5, this correction will continue and the first target of this correction will be the $25 range. Therefore, any pullback to the range of $37.5 and especially candle rejection will confirm the downward trend in the low time.

AVAX may bounce backAVAX has returned to its previous trend and could start a new move from here. The positive atmosphere that may occur with the ETF news may start a new rally. Can be entered with spot or low leverage.

⚡️AVAXUSDT CMC TRADING ⚡️ BREAKOUT AND PULLBACKAVAXUSDT has undergone a Change of Character (ChoCh) and is currently in a pullback phase to interact with the Order Block (OB) responsible for the ChoCh. We anticipate a price reversal above the OB and the identified demand zone, facilitated by a significant pullback. Our expectation is for the reversal to lead towards a revisit to the most recent swing high on the chart.

AVAX: Pullback in UptrendTrade setup : Following a bullish break above $35 key level, price reached our target of $50 resistance. However, price got very overbought (RSI ~ 82) and price has pulled back on some profit taking. The nearest horizontal support is $35 while the nearest Fibonacci Retracement levels (possible support) are $38 (38.20%), $34 (50%), and $31 (61.80%). Hence, pullback to $34-39 support zone could be an attractive swing trade entry area with upside potential back to $50. Stop Loss (SL) at $32 (just below prior swing low).
Trend : Neutral on Short-Term basis and Uptrend on Medium- and Long-Term basis.
Momentum is Bearish (MACD Line is below MACD Signal Line, and RSI is below 45).
Support and Resistance : Nearest Support Zone is $35, which it broke, then $25. The nearest Resistance Zone is $50.

In trend-bear (AVAX)📊Analysis by AhmadArz:
Next break renge
🔍Entry: 33.416
🛑Stop Loss: 34.504
🎯Take Profit: 32.346
🔗"Uncover new opportunities in the world of cryptocurrencies with AhmadArz.
💡Join us on TradingView and expand your investment knowledge with our five years of experience in financial markets."
🚀Please boost and💬 comment to share your thoughts with us!

AVAX: Pullback in UptrendTrade setup : Following a bullish break above $35 key level, price reached our target of $50 resistance. However, price got very overbought (RSI ~ 82) and price has pulled back on some profit taking. The nearest horizontal support is $35 while the nearest Fibonacci Retracement levels (possible support) are $38 (38.20%), $34 (50%), and $31 (61.80%). Hence, pullback to $34-39 support zone could be an attractive swing trade entry area with upside potential back to $50. Stop Loss (SL) at $32 (just below prior swing low).
Trend : Neutral on Short-Term basis and Uptrend on Medium- and Long-Term basis.
Momentum is Mixed as MACD Line is below MACD Signal Line (Bearish) but RSI ~ 50 (Neutral).
Support and Resistance : Nearest Support Zone is $35 (previous resistance), then $25. The nearest Resistance Zone is $50.

⚡️AVAXUSDT CMC TRADING ⚡️ HEAD & SHOULDER AVAXUSDT has recently breached a critical support level following the formation of a head and shoulders pattern. This development indicates a significant potential downward movement to finalize the structural breakout. Anticipating a retracement towards the trend line identified on the daily timeframe is our outlook.

AVAX potential downside to $35My MACD-VWAP indicator signaling potential downside for AVAX to $35 in the coming weeks. My next buy the dip zones are 35 dollars and if we break that with volume, the next downside target is 28 dollars. While in the long run I'm bullish on AVAX, in the near term we may pull back to 28-35 zone that is health for continuation of the longer term bullish structure.
For a limited time I will give free access to my indicator that has been catching winning trades. DM me to request access.
Read the rules of the the trading system below.

AVAXUSDTBINANCE:AVAXUSDT Short idea
⛔"Daily crypto market analyses I provide are personal opinions & not financial advice. Trading carries risks, so do your own research & seek advisor's help. #DYOR
Don't forget to 🚀 and comment

AVAXUSDT: 4HR VIEW BINANCE:AVAXUSDT currently in consolidation phase, few candles show some bullish character and we expect a nice clean move from this area. Though, if price decides to remain bearish then it can fall further down where there is imbalance which price will likely to fill before it touches the 55.00 region.
What do you think about this pair, do you think it will create a new record?

AVAX: Pullback in UptrendTrade setup : Following a bullish break above $35 key level, price has reached our target of $50 resistance. However, price got very overbought (RSI ~ 82) and we’re seeing some profit taking. Now we wait for the right entry area (support). How far could it pull back? The nearest horizontal support is $35 and the nearest Fibonacci Retracement levels (possible support) are $38 (38.20%), $34 (50%), and $31 (61.80%). Hence, pullback to $34-39 support zone could be an attractive swing trade entry area with upside potential back to $50.
Trend : Uptrend across all time horizons (Short- Medium- and Long-Term).
Momentum is Mixed as MACD Line is below MACD Signal Line (Bearish) but RSI ~ 50 (Neutral).
Support and Resistance : Nearest Support Zone is $35 (previous resistance), then $25. The nearest Resistance Zone is $50.
latest movement..? (AVAX)❤️❤️Thanks for boosting 🚀 and supporting us!
📈when in bull-trend we can trade in bull-trend in small correction ___ with distance measuremove last movement for reverse trend.
🔗 For more communication with us, In the footnote and send a message in TradingView.
👨🎓 Experience and Education: Our trading team has five years of experience in financial markets, especially cryptocurrencies.

#ARBUSDT NEXT MOVEBe safe with Trade new buying rang in box #ARBUSDT #BTCUSDT #KUCOIN #MEMECOIN #DOT #ETH

BOBUSDT next MoveBe Ready with Your Trade. i am ready Are you !!!
#BOBUSDT #BONKUSDT #KUCOIN #AVAXUSDT #BTCUSDT

BTCUSDT NEXT MOVE Bitcoin will enter liquidity zone, signals potential downturn in market sentiment after that. be safe with trade.

AVAXUSDT - CRYPTO TIPWelcome to my TradingView profile! In this article, we will embark on a journey together to explore the intriguing prospects of AVAXUSDT, guided by the fundamental principles of market structure and Fibonacci retracement. I invite you to join me in analyzing one of the most traded currency pairs.
Our primary instruments will be market structure, the identification of the trend direction, and the application of Fibonacci levels. We will delve into how these factors can provide meaningful insights for making informed trading decisions.
he inclusion of detailed charts and illustrations will aid in visualizing the discussed concepts. We will explore key Fibonacci retracement levels and how they interact with the overall market structure.
This will be an informative article, focusing on understanding the market context and applying fundamental concepts of technical analysis. The goal is to provide a clear perspective and stimulate critical thinking within our trading community.
If you find this analysis valuable, I encourage you to subscribe to stay updated on my latest posts and market analyses. This is just the beginning, and subscribing will allow you to be among the first to receive updates and trading ideas.
Feel free to make any adjustments or let me know if there's anything specific you'd like to modify!

AVAX: Pullback in UptrendTrade setup : Following a bullish break above $35 key level, price has reached our target of $50 resistance. However, price got very overbought (RSI ~ 82) and we’re seeing some profit taking. Now we wait for the right entry area (support). How far could it pull back? The nearest horizontal support is $35 and the nearest Fibonacci Retracement levels (possible support) are $38 (38.20%), $34 (50%), and $31 (61.80%). Hence, pullback to $34-38 support zone could be an attractive swing trade entry area with upside potential back to $50.
Trend : Uptrend across all time horizons (Short- Medium- and Long-Term).
Momentum is Mixed as MACD Line is below MACD Signal Line (Bearish) but RSI > 55 (Bullish).
Support and Resistance : Nearest Support Zone is $35 (previous resistance), then $25. The nearest Resistance Zone is $50.

Avax Final Leg UPLonging Avax at 46.8-47.3 from here.
I believe next leg up to 54-55 is coming and i think that will be the final one.
Wil cut if it stays below 46.3.
Note: Not a Financial Advice.

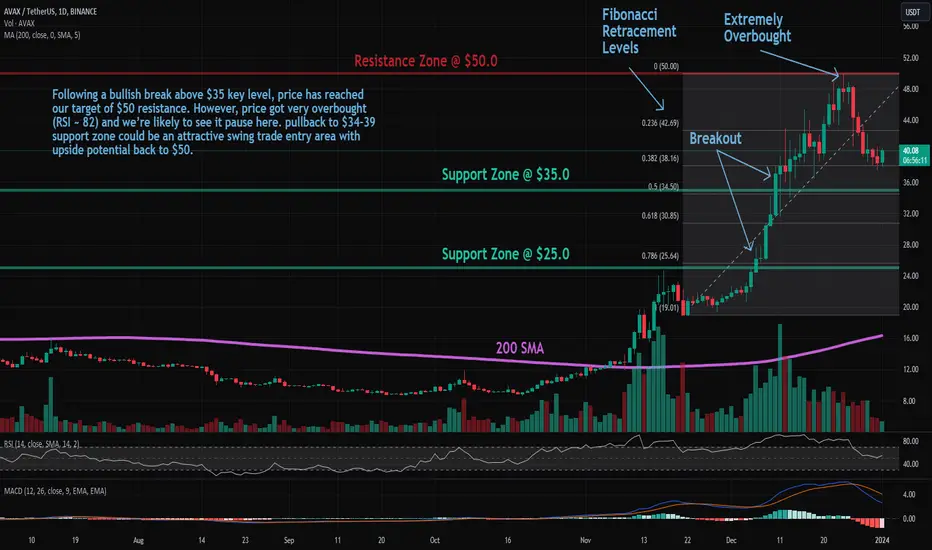
AVAX: Overbought at ResistanceTrade setup : Following a bullish break above $35 key level, price has reached out target of $50 resistance. However, price got very overbought (RSI ~ 82) and we’re likely to see it pause here on some profit taking.
Trend : Uptrend across all time horizons (Short- Medium- and Long-Term).
Momentum is Bullish but extremely overbought. (MACD Line is above MACD Signal Line). RSI is bullish (> 55) but extremely overbought (> 80) which could imply that price could briefly pause or pull back if it reaches Resistance.
Support and Resistance : Nearest Support Zone is $35 (previous resistance), then $25. The nearest Resistance Zone is $50.

Avaxusdt ... Tecnicall analysis Can Avax continue to grow? The answer is yes, because according to Fibonacci we are now halfway up and I expect more growth to the mentioned areas.

AVAXUSDT - LONG Setup!!AVAXUSDT (1D Chart) Technical analysis
AVAXUSDT (1D Chart) Currently trading at $11.3
Buy level: Above $11.2
Stop loss: Below $9.5
TP1: $12.5
TP2: $15
TP3: $18
TP4: $22
Max Leverage 2x
Always keep Stop loss
Follow Our Tradingview Account for More Technical Analysis Updates, | Like, Share and Comment Your thoughts
