TradeCityPro | AVAXUSDT Watch the Altcoins!👋 Welcome to TradeCityPro Channel!
Let’s dive into the analysis of one of my favorite coins, which is likely to make a move this week. Let’s break it down and take a closer look together!
🌐 Overview Bitcoin
Before starting the analysis, I want to remind you again that we moved the Bitcoin analysis section from the analysis section to a separate analysis at your request, so that we can discuss the status of Bitcoin in more detail every day and analyze its charts and dominances together.
This is the general analysis of Bitcoin dominance, which we promised you in the analysis to analyze separately and analyze it for you in longer time frames.
📊 Weekly Timeframe
On the weekly timeframe, the AVAX chart is one of the smoothest and most technical charts I’ve seen—support and resistance levels work like a charm, and price patterns are fairly predictable.
After getting rejected at the key resistance of 53.62—a historically significant level—sellers stepped in, pushing us into a deep correction. The failure to break this level was partly because we didn’t enter overbought territory on the weekly chart.
For buying, the weekly chart is currently very bearish, so jumping in now isn’t logical. However, a break above 53.82 would be our most reliable trigger for an upward move. For exiting, if we drop below 21.02, I’d personally cash out. If we climb back above 21.02, I’d buy again—this time with fewer AVAX but the same USDT amount to manage risk.
📉 Daily Timeframe
In the daily timeframe, after a rejection at 53.96 that led to a correction, it seemed likely we’d test this resistance again. However, after the rejection, we broke below 44.21, forming a price range box.
Right now, we’re not paying much attention to resistance levels. Our trendline is showing lower highs but flat lows, indicating that our movement is driven by the trendline rather than traditional support and resistance.
With that in mind, a break of the trendline could spark a move, but we still need a trigger. The 22.71 level is our breakout trigger—not just a resistance. If we break it, we could enter a buy with a risky stop loss at 16.00. Confirmation would come from a spike in volume. For selling, if we get rejected at the trendline and break below 16.00, I’d personally exit.
✍️ Final Thoughts
Stay level-headed, trade with precision, and let’s capitalize on the market’s top opportunities!
This is our analysis, not financial advice—always do your own research.
What do you think? Share your ideas below and pass this along to friends! ❤️
AVAXUSDT
AVAX Is Ready For Big Storm !!!Avax forming a big symmetrical triangle on weekly time frame & currently is sitting on big symmetrical support...
Although currently is in macro 2nd wave which seems to be end...
Soon we may see big moves in Avax storming straight out of triangle, targeting first at 104$ and 2nd around 500$ which aligns which triangle target along with macro 5th wave...
Avalanche (AVA): Overextended! Is This Ready for a Bullish Move?Avalanche (AVAX) is currently presenting an intriguing setup, with price action showing signs of being overextended on the daily and 4-hour timeframes. The cryptocurrency has recently traded into a critical support zone, defined by previous swing lows on the daily chart. This area has historically acted as a strong demand zone, attracting buyers. However, AVAX has now dipped below these lows, triggering sell-side liquidity in the form of stop-loss orders placed beneath this level. This liquidity grab could be a precursor to a potential bullish reversal. 🚀
On the 15-minute timeframe, AVAX is consolidating within a tight range, reflecting indecision among market participants. A break above this range, coupled with a bullish market structure shift, could signal the start of a reversal and provide a high-probability buy opportunity. This setup aligns with the concept of a "liquidity sweep," where price manipulates stop orders before reversing direction.
Key Observations:
Daily Timeframe: Price has dipped below key swing lows, eating into sell-side liquidity.
4-Hour Timeframe: Overextension is evident, with price trading into a significant support zone.
15-Minute Timeframe: Consolidation within a range, awaiting a breakout.
Trading Plan:
Wait for Confirmation: Monitor the 15-minute timeframe for a bullish breakout above the current range. 📈
Market Structure Shift: Look for higher highs and higher lows to confirm bullish intent. 🔍
Entry Strategy: Enter long positions after a confirmed breakout, with a stop-loss placed below the range low. 🛡️
Target Levels: Aim for resistance zones on the 4-hour and daily timeframes as potential take-profit areas. 🎯
Key Levels to Watch:
Support Zone: Previous daily swing lows (now acting as a liquidity zone).
Resistance Zone: The upper boundary of the 15-minute range and key levels on the 4-hour chart.
This setup highlights the importance of patience and discipline in trading. While the liquidity grab below support is a promising signal, confirmation of a bullish breakout is essential to avoid false moves. As always, this is not financial advice, and traders should conduct their own research before making any decisions. ⚠️
Possible Scenario for AVAX/USDTPossible Scenario for AVAX/USDT:
1. Price Action: The price is within a descending channel marked by the blue lines. This suggests a bearish trend as the price has been making lower highs and lower lows.
2. Potential Scenarios:
- The **green arrow** indicates a potential bullish scenario, where the price might break out to the upside, aiming toward a target of around $31.84.
- The **red arrow** suggests a bearish scenario, where the price might break down further, potentially testing the lower support level near $11.91.
3. Key Levels:
- **Resistance**: Around the $31.84 level (shown in red), which could be a strong resistance zone if the price attempts a recovery.
- **Support**: Near the $11.91 level (shown in green), which could act as strong support if the downtrend continues.
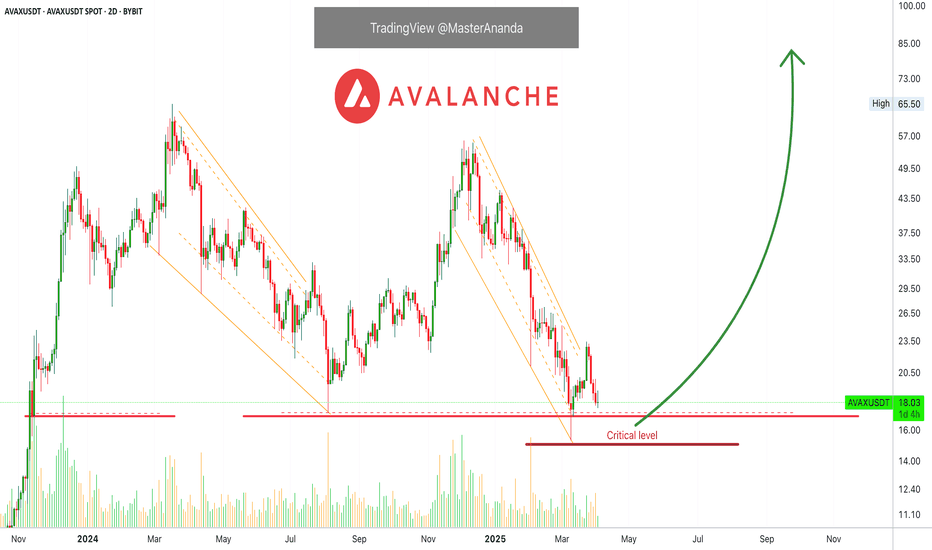
Avalanche's Higher Low Indicates The Bottom Is InAVAX is currently trading above its August 2024 bottom low price, and this is bullish.
AVAXUSDT produced a major low on the 10-March trading session. The current session is a higher low compared to this date. This is a double bullish signal. The August low and last month. Both are active, valid and hold.
So the August 2024 low was actually tested and pierced but the session close happened above this level. The bottom back then was $17.27. In March, AVAXUSDT went as low as $15.30 but closed at $17.51. The next session went below again and hit $16.95 but closed at $18.5. As you can see, the bulls win.
The current session is green after four sessions closing red. Each session has two candles, 48 hours (2D candles).
Here we have the activation of long-term support. Classic behaviour before a major bullish run.
The dynamic is always this: The correction unravels and gains momentum before reaching its end. When it hits bottom, there is a strong reaction causing a sudden bullish jump. This bullish jump is short-lived and quickly corrected. This short-term correction ends in a higher low. From this higher low, prices start a new wave of growth. We are entering this new growing phase now.
Thanks a lot for your continued support.
This is another time based chart.
The time to enter is now, always focusing on the long-term.
We buy now with the patience and mindset to hold between 6-8 months. If this can be done, easy and big wins will be yours.
The 2025 All-Time High potential and more can be found by visiting my profile.
Thanks a lot for the follow. Your support is appreciated.
Namaste.
#AVAXUSDT: Three Swing Buy Take Profit EntriesThe cryptocurrency market has experienced volatility in recent months, particularly with the #AVAXUSDT token. We have identified two potential price reversal points:
1. **Current Price Range:** The market is currently experiencing a surge in volume, indicating a potential reversal.
2. **Liquidity Removal and Reversal:** If the price were to remove liquidity and subsequently reverse at its previous low, it could trigger a significant price drop.
Additionally, we recommend setting three targets based on your analysis to guide your trading decisions.
We extend our sincere gratitude for your unwavering support since the beginning. We anticipate that this support will continue to grow and evolve.
Team Setupsfx_
🚀❤️
Avax long term.This is my opinion on Avax.
I think the downward waves are good buying opportunities, while the upward waves after that can be good selling opportunities.
* What i share here is not an investment advice. Please do your own research before investing in any digital asset.
* Never take my personal opinions as investment advice, you may lose all your money.
AVAX Long TriggerAVAXUSDT | Long Trigger Setup 🚀
AVAX is forming a bullish structure on the 15-minute timeframe, respecting an ascending trendline while consolidating near key resistance levels. The price is currently finding support at $18.67, where buyers have stepped in multiple times, indicating demand.
A breakout above $19.06 (previous resistance) could confirm a continuation towards higher levels, with the next major target at $19.79.
🔹 Technical Analysis:
✅ Ascending Trendline Support: Higher lows suggest bullish momentum.
✅ EMA Alignment: Price is interacting with the 7, 25, and 99 EMAs, signaling potential upside if reclaimed.
✅ Volume Analysis: Increasing volume on green candles suggests accumulation.
📊 Key Levels:
🔹 Immediate Support: $18.67
🔹 Breakout Resistance: $19.06
🔹 Major Target: $19.79
🔹 Trendline Support: Holding structure above $18.67
🚀 Long Setup Confirmation:
A break and retest of $19.06 with strong volume could confirm a bullish breakout, targeting $19.79. If buyers step in aggressively, momentum may push even higher.
🔻 Invalidation & Risk Management:
A break below $18.67 with volume could invalidate this setup.
A cautious stop-loss can be placed slightly below $18.67 to manage risk efficiently.
This setup offers a high-reward potential if conditions align, making it a strong long opportunity if executed correctly.
#AVAX #Crypto #Trading #LongSetup #Breakout #TechnicalAnalysis 🚀
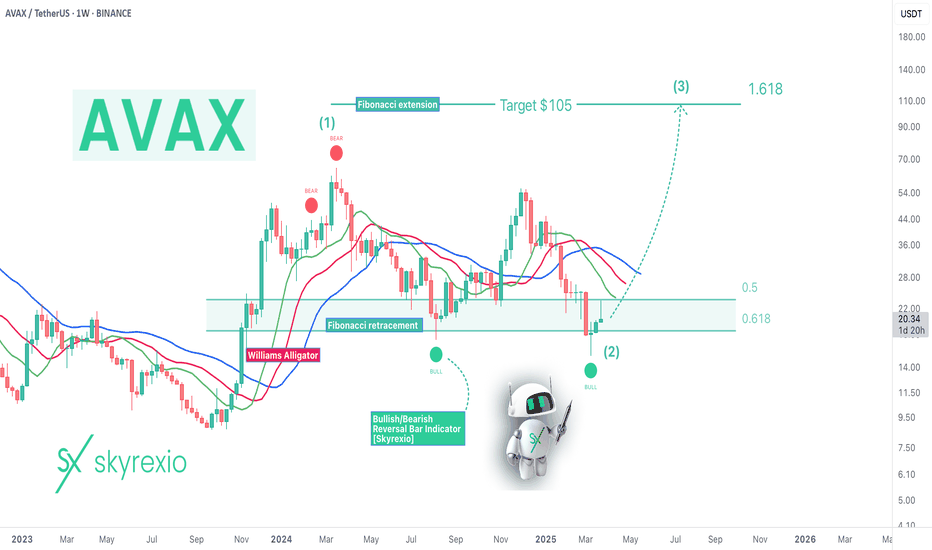
Avalanche AVAX Will Reach $100+ In 2025!Hello, Skyrexians!
Let's make an update on BINANCE:AVAXUSDT the coin with the most clear Elliott waves structure. We have some changes since our last update.
Let's take a look at the weekly chart. We can count the growth from the bottom to the March 2024 top as the wave 1. After that we can see the flat correction ABC in the wave 2. The great sign that price has printed even 2 green dots on the Bullish/Bearish Reversal Bar Indicator inside the Fibonacci 0.61 zone. We expect that for this asset correction is over and the next target is 1.61 extension for the wave 3. Now it's located at $105.
Best regards,
Skyrexio Team
___________________________________________________________
Please, boost this article and subscribe our page if you like analysis!
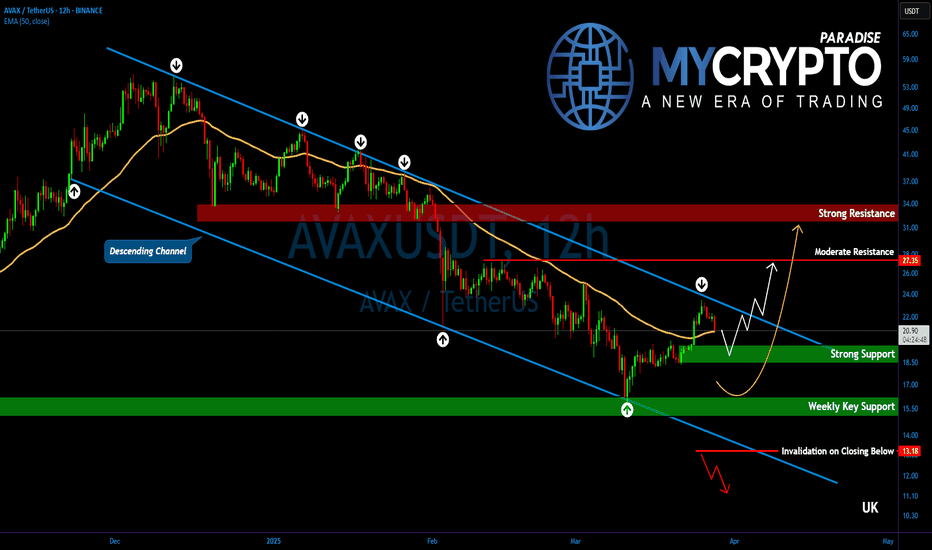
AVAX Is Approaching a Make-or-Break Level — What Comes Next?Yello, Paradisers! Is #AVAX finally waking up after months of bearish slumber, or is this just another bull trap? After moving within a well-defined descending channel for weeks, we are now seeing the first real shift in structure: AVAXUSDT has just broken above its 12-hour EMA convincingly for the first time since November 2024. This development may be a strong early signal of a potential corrective move to the upside.
💎At the moment, #AVAXUSDT is testing a critical resistance at the $23.50 level, which lines up with the descending trendline that has capped price since December 2024. A breakout above this zone would significantly increase bullish momentum, with the next target likely at $27.35 — a key area of moderate resistance that could temporarily halt upward movement.
💎However, $27.35 is not expected to be an easy level to break. Sellers will likely defend this zone, potentially causing short-term volatility. But if bulls manage to flip it into support, the path opens toward the $31.20 to $34.00 region. This higher resistance area is even more significant as it aligns with the 50% Fibonacci retracement level — a major technical barrier where many traders will be looking to take profits or fade the rally.
💎On the downside, AVAX has established a strong support range between $19.50 and $18.80. If this short-term support fails, we then look to the weekly support zone between $16.20 and $15.00, which continues to serve as a long-term base structure. As long as AVAX holds above this broader support, the larger bullish outlook remains intact.
Paradisers, strive for consistency, not quick profits. Treat the market as a businessman, not as a gambler.
MyCryptoParadise
iFeel the success🌴
AVAX Trade Setup - Waiting for Retrace to SupportAVAX has had a strong run over the last two weeks. Now, we're waiting for a retrace to key support before entering a long spot trade.
🛠 Trade Details:
Entry: Around $20.00
Take Profit Targets:
$23.50 (First Target)
$31.00 (Extended Target)
Stop Loss: Just below $18.00
Watching for buying pressure at the support level before confirming the move! 📈🔥
AVAX/USDTHello friends
As you can see, the price has been well supported by buyers from the specified support area...
Now you can buy in steps with capital and risk management and move to the specified targets.
The red resistance area can also cause a price correction, so be careful and take profit.
*Trade safely with us*
#AVAX/USDT#AVAX
The price is moving within a descending channel on the 1-hour frame, adhering well to it, and is heading for a strong breakout and retest.
We are seeing a bounce from the lower boundary of the descending channel, which is support at 18.22.
We have a downtrend on the RSI indicator that is about to be broken and retested, supporting the upward trend.
We are looking for stability above the 100 Moving Average.
Entry price: 19.12
First target: 19.55
Second target: 20.14
Third target: 20.74
Is #AVAX Making Much Needed Comeback or Another Bull Trap Ahead?Yello, Paradisers! Is #AVAX on the verge of a major breakout, or is this just another bull trap? Let's look at the latest setup of #Avalanche:
💎#AVAXUSDT has been stuck inside a falling wedge for weeks, respecting both the descending resistance and descending support levels. However, bulls have finally pushed through the upper trendline, signaling a potential shift in market sentiment. The question now is: will it sustain the momentum, or will we see a sharp rejection at key resistance levels? AVAX has been stuck inside a falling wedge for weeks, the breakout shows a high probability of an impulsive move toward the highlighted zones.
💎The immediate support to keep an eye on sits around $18.38, a level that could act as a strong demand zone if retested. Below that, $16.61 serves as a critical invalidation level for the bullish setup. A breakdown here would shift the momentum back in favor of the bears.
💎On the upside, #AVAX faces its first major challenge between $23.00 and $26.00, where sellers are likely to step in. A clean breakthrough of this zone would open the door for a more aggressive rally. RSI & Volume Confirmation – The RSI is showing early signs of strength, but volume confirmation is still needed. A strong push above the resistance zone on high volume would solidify the bullish breakout.
💎If #AVAXUSD can flip $18.38 into strong support, we could see an impulsive move toward the $23-$26 range. However, a failure to hold support could result in a bearish breakdown toward the $14 region.
The market rewards discipline and patience—trade smart, Paradisers!
MyCryptoParadise
iFeel the success 🌴
AVAXUSDT Testing Key Resistance Amid Bearish Market OutlookAVAXUSDT has been steadily climbing after rebounding from a crucial support level and is now testing last week's high, a level that has repeatedly held firm. Additionally, the price continues to respect the established upward trendline. However, on higher timeframes, the overall market sentiment remains strongly bearish, with prices falling below the August 2024 low. Given the significant downward movement, a period of consolidation is likely. A rebound from the psychological level at 20 is anticipated, followed by a retest of the support zone around 17.05
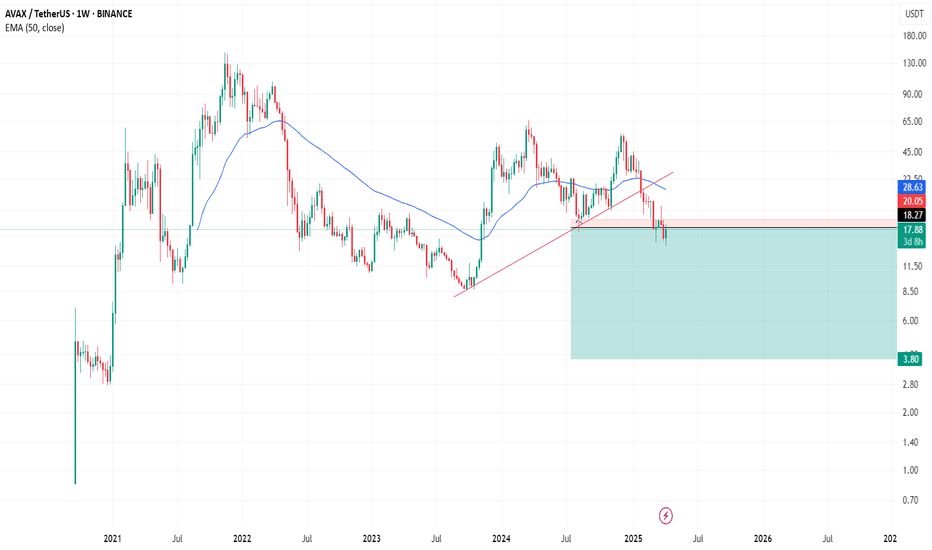
avax sell midterm "🌟 Welcome to Golden Candle! 🌟
We're a team of 📈 passionate traders 📉 who love sharing our 🔍 technical analysis insights 🔎 with the TradingView community. 🌎
Our goal is to provide 💡 valuable perspectives 💡 on market trends and patterns, but 🚫 please note that our analyses are not intended as buy or sell recommendations. 🚫
Instead, they reflect our own 💭 personal attitudes and thoughts. 💭
Follow along and 📚 learn 📚 from our analyses! 📊💡"
AVAXUSDT Breakdown Alert – Are Lower Lows Coming Next?Yello, Paradisers! Is AVAXUSDT gearing up for a bigger drop? Let’s break it down.
💎AVAXUSDT has turned bearish after breaking below its key support trendline. A Change of Character (CHoCH) confirms the shift to the downside, and right now, the price is rejecting from a critical 4H Fair Value Gap (FVG) and the 200 EMA resistance zone. Adding to the bearish pressure, we also see a 4H bearish divergence, making a downside move highly probable.
💎Moreover, AVAXUSDT is in the process of forming a Head & Shoulders pattern, which increases the risk-to-reward (RR) potential for short trades. On top of that, there’s liquidity resting below, which could act as a magnet, pulling the price further down.
💎However, if the price breaks out and closes a candle above the 200 EMA resistance zone, this bearish outlook will be invalidated. In that case, it’s better to wait for clearer price action before making any moves.
🎖Patience is key, Paradisers. Stick to the strategy, avoid emotional trading, and let the market come to you. The best setups will always present themselves to those who wait!
MyCryptoParadise
iFeel the success🌴
avax long midterm "🌟 Welcome to Golden Candle! 🌟
We're a team of 📈 passionate traders 📉 who love sharing our 🔍 technical analysis insights 🔎 with the TradingView community. 🌎
Our goal is to provide 💡 valuable perspectives 💡 on market trends and patterns, but 🚫 please note that our analyses are not intended as buy or sell recommendations. 🚫
Instead, they reflect our own 💭 personal attitudes and thoughts. 💭
Follow along and 📚 learn 📚 from our analyses! 📊💡"
AVAX Breakdown Incoming? Key Levels to Watch Now!Yello, Paradisers! Is AVAXUSDT about to take another dive, or are the bulls finally ready to step in? Let’s break it down!
💎#AVAXUSDT remains firmly in a downtrend, struggling to gain bullish momentum while continuously rejecting key supply zones. Recently, the price tapped into the imbalance zone around $21.5, but sellers smacked it right back down a clear sign that bears are still in control.
💎Adding to the bearish case, a descending trendline and moving averages are acting as resistance, keeping price action suppressed. The structure continues to form lower highs and lower lows, reinforcing downside momentum.
💎If Avalanche retests the $22.5 supply zone and faces rejection, another leg down toward $18.956 is likely, with the next major support sitting at $17.523. Right now, if the price closes below the 50 EMA, there’s a strong probability it will directly target our projected support levels. A failure to attract strong buying interest at these levels would confirm further downside continuation.
💎However, if AVAX manages to break through the $22.5 supply zone, our focus shifts to the next major resistance at $24.136. A breakout above this level with strong volume could invalidate the bearish setup, potentially pushing price toward $24 - $25. A confirmed move past $24.136 would shift momentum bullish, opening the door for a rally toward $26 and beyond.
Stay sharp, Paradisers! The market rewards patience and discipline. If we get confirmation, we act. If not, we wait. Trade smart, not fast! 🎖
MyCryptoParadise
iFeel the success 🌴


