AVGO

12/5/21 AVGOBroadcom Inc. ( NASDAQ:AVGO )
Sector: Electronic Technology (Semiconductors)
Current Price: $558.12
Breakout price: $567.50
Buy Zone (Top/Bottom Range): $555.60-$544.00
Price Target: $614.00-$622.00
Estimated Duration to Target: 55-60d
Contract of Interest: $AVGO 1/21/22 560c
Trade price as of publish date: $22.25/contract


9/19/21 AVGOBroadcom, Inc. (AVGO)
Sector: Electronic Technology (Semiconductors)
Current Price: $506.00
Breakout price trigger: $488.40 (hold above)
Buy Zone (Top/Bottom Range): $501.70-$488.40
Price Target: $538.00-$541.80
Estimated Duration to Target: 55-70d
Contract of Interest: $AVGO 11/19/21 520c, $AVGO 11/19/21 540c
Trade price as of publish date: $11.90/cnt, $5.90/cnt

AVGOEarnings on Thursday 9/2. There is a 24 point move priced in.
Calls can work over 495.
Lotto Trade Idea: 520C

AVGO is breaking out of huge resistance areaNASDAQ:AVGO closed above a long time resistance level with good potential to create new historic highs in the near future IF if we do fall back into consolidation area.
Targeting first level 508.9
Second level 533.1
Fingers crossed


AVGO Swing OptionBuy Call $495 Strike 7/23. Price target $503
Sitting above the 200 ma we have parabolic sar showing and a MACD crossed over the Signal Line. Great setup


AVGO - STOCKS - 12. APR. 2021Welcome to our weekly trade setup ( AVGO )!
-
4 HOUR
Overall bullish market scenario.
DAILY
Closure and break above previous resistance.
WEEKLY
Expecting more upside price action.
-
STOCKS SETUP
BUY AVGO
ENTRY LEVEL @ 480.00
SL @ 450.24
TP @ Open
Max Risk: 0.5% - 1%!
(Remember to add a few pips to all levels - different Brokers!)
Leave us a comment or like to keep our content for free and alive.
Have a great week everyone!
ALAN

AVGO (NASDAQ) - Prepare buy if break upGreetings
Humbled, we would like to thanks for your support who has already liked, commented and followed us. Your support, strengthens us, to help in analyzing the market. If you have any questions, do not be hesitant to send us message (inbox). Our Service : Signal recomendation, Trading Course, Portofolio Consultation for multi asset such as Stock, FX, Derivative, Crypto, etc. If u are newbie on the stock market, do not be hesitant to contact me at Private Message. Our Job is to make u Prof trader and proftable trader.
Strategy
- Please care for Money Management
- Have a good psychology
- Do not be hurry to open position
- Evaluate and upgrade your trading plan
AVGO (NASDAQ) - Prepare buy if break up

$AVGO finds a FORK on the FIBO roadBroadcom comes to an interesting fork on the road.
Friday, like many semi's, was breaking down from it's upward trend.
I'd like to see it bounce off of FIBO retracement and continue going up. Buy signal with 8 confirmations should pop up.
If it breaks support, I see it going all the way down to 420--hopefully I'm so wrong!
The good news is that POC is around the 418-422 range, so it'll take some major new event to break further down.
Happy Trading, from CJ -- aka the greatest FURU.
To find out more about The Ultimate Stock Indicator on Tradingview, please check my public profile.


AVGO - Broadcom Inc. buy support zonesHello traders,
Description of the analysis:
Broadcom Inc. ( AVGO ) support zones where it makes sense to time long positions. A possible correction could provide a shopping opportunity in interesting volume zones. It is definitely worth following further developments. The thickness of the support zone reflects the importance of this zone. Red lines are fair prices by volume .
About me:
Hi, my name is Jacob Kovarik and I´m trading on stock exchange since 2008. I started with a capital of 3000 USD. My first strategy was based on OTM options. (American stock index and their ETF ). I´ve learnt on my path that professional trading is based on two main fundaments which have to complement each other, to make a bussiness attitude profitable. I´ve tried a lot of techniques and many manners how to analyze the market. From basic technical analysis to fundamental analysis of single title. My analytics gradually changed into professional attitude. I work with logical advantages of stock exchange (return of value back to average, volume , expected volatility , advantage of high stop-loss, the breakdown of time in options, statistics and cosistent thorough control of risk). At the moment, my main target is ITM on SPM index. Biggest part of my current bussiness activity comes from e mini futures (NQ, ES). I´m trader of positions. I´m from Czech republic and I take care of a private fund (over $4.000.000 USD). During my career I´ve earned a lot of valuable experience, such as functionality of strategies and what is more important, control of emotions. Professional trading is, in my opinion, certain kind of mental training and if we are able to control our emotions, accomplishment will show up. I will share with you my analysis and trades on my profile. I wish to all of you successul trades.
Jacob

Broadcom Should Break Out SoonNASDAQ:AVGO is repeating the same pattern from 2 months ago before it broke out. Look for entries near trend line supports or on a break out. Support and resistance levels are clearly marked via the trend lines. Also, when the ADX crosses bullish it will be an extra long indicator.

AVGO Long set upGood company with over 3.5% dividend. Growth stock. Retesting the breakout are. I think it's a good buy there. I will watch to add some there for a long term growth and earn yield. This is not a recommendation to buy or sell any financial asset. These posts are for educational purposes only. Please do your own homework before purchasing any assets.


AVGO Go Go!BROADCOM just broke out to new all time highs, launched from an ascending triangle... I like!
Earnings call on Sept 3rd may move it further... Relatively late to the tech party but never too late.

AVGO LONG OR BUY , SHS PATTERN TARGET UP TO $450AVGO confirmed successful SHS pattern, I opened Long here.
AVGO buy : $335 .
AVGO target : $450.
Stop loss : 8% (investing long term) .
Wish you a good deal!

LONG AVGO if $328 holdsAVGO breakout 8/4 but there is resistance at $328.10. If we get volume, LONG!


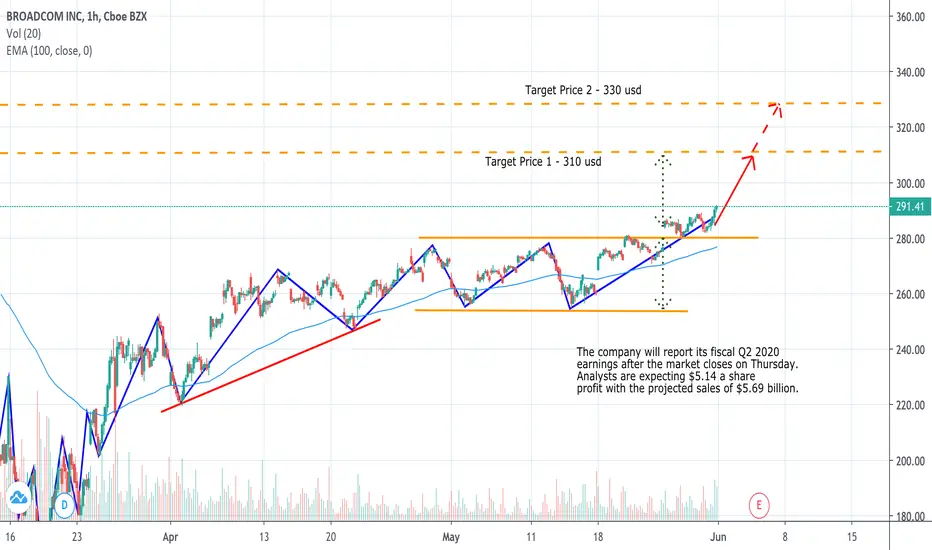
Broadcom - AVGO Technical AnalysisThe market is Bullish.
The idea is to go long following the major trend and hope that the Earning report due on Thursday will bring positive news.
Fundamental Analysis:
The company will report its fiscal Q2 2020 earnings after the market closes on Thursday. Analysts are expecting $5.14 a share profit with the projected sales of $5.69 billion.