Avwap
TRX - Double signal short Wyckoff Up-Trust + PRS Reading the chart (annotations in sync with chat):
1. Largest Up volume wave
3. Resistance Level coming from Daily chart
3. Fast Up Wave (could be fake)
4. Placed AVWAP on fast wave and
5. Our Entry: Double Plutus signal after the retracement Wyckoff Up- Trhust + PRL
Enjoy reading the waves , speed index and Plutus signals.
ADA- Cardano - Classic Exit from Range with Plutus signalReading the chart :
AVWAP acted as resistance and we started ranging.
This is a classic entry long for the "SI traders" called Exit from Range with a Plutus signal and in this case it was the PRL signal.
ADA is heading for a major Fib I will not advise any entries now.
Enjoy wave and speed index reading!
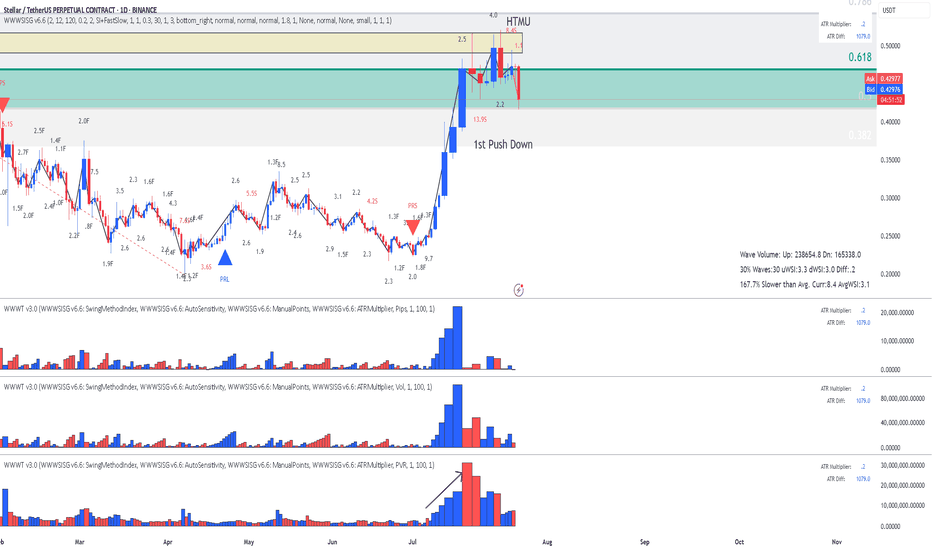
XLM - Stellar - Possible Short coming up - This is Why?Reading the chart (annotations in sync with chart):
1. Location: Fib over-shoot - possible sellers
2. Largest up volume - possible sellers in there
3. Mountain shape PVR - increasing volume as wave progress
4. Abnormal SIs at top (could be closing positions but it also could be sellers absorbing buy orders.
Risky Entry but with better RR enter now. stop above tops, target blue AVWAP
Conservative Entry with worse RR: wait for the break downwards of red AVWAP, target blue AVWAP.
Enjoy, wave and speed index reading!
LTC - Litecoin - After the Short the LongAfter the short Signal on the AVWAP line we found buyers at the bottom.
1. PVR mountain shape is the first indication that buyers are coming in.
2. Abnormal SI 5.6 is what I call 1st Push Up.
Finally the entry Plutus signal PL.
You should be careful now because we are crossing Fib 61.8, get you profits sellers might be in that high volume bar. The reaction later waves will be indication if we are going to continue or reverse.
Enjoy Trading the Volume Wave and Speed Index!
ETHFI _ just went Long reading the waves and Speed IndexReading the recent history of the waves (annotations in sync with the chart):
1. Support
2. Huge volume on PVR indicator at the bottom (buyers)
3. Abnormal Speed Index 55.7 on the down wave , that's Hard to Move Down , more buyers
4. Finally the Entry on a PRL signal.
Enjoy!
PS. I have no idea what this ETHFI crypto is, I just analyzed the chart and it looked like a high probability trade.
XLM Stellar - Classic Lesson 15 said Long Lesson 15 methodology (annotations in sync with the chart):
1. Support (this where buyers can come in)
2. Largest dn volume wave after a while - Look left - buyers came in previously at the same location.
3. Placed AVWAP and waited for price to cross upwards and pullback again on AVWAP
4. Entry signal PRL with abnormal SI 11.2 (price has a hard time to move down - absorption) after the pullback and that's our entry.
Enjoy!
SHIB - Lesson 15 this is how to read the chartUsing Lesson 15 to read the chart (annotations in sync with chart):
1. Support (coming from daily chart)
2. Largest down wave (buyers could be in there)
3. Placed AVWAP wait for the price to cross upwards and pull back
4. PFBL Long signal on the pull back and up we go
Enjoy !
AAVE - Lesson 15 said Long and the pull back another LongReading the chart using Lesson 15 and Exit from Range methodology (annotations in sync with the chart)
1. Fib Location (buyers might enter)
2. Largest down volume wave (potential buyers in there) - Placed AVWAP at the beginning of the down wave wait for price to cross upward and pullback
3. Entry Long with PRL signal - first target fib closed with profit
4. Fib was reached and pull back started
5. PRL long on AVWAP acting a resistance
6. This my last Entry using strategy Exit from Range with a Plutus signal.
This is a risky Long since we are on Fib area, but I will take the risk.
Enjoy!
Beating the S&P 500 with TradingView's Stock ScreenerThis is Mo from MWRIGHT TRADING. The date is Friday, June 27th, 2025.
This video is about selecting stocks that collectively have the potential to consistently beat the S&P 500
I look for smooth and consistent long-, mid-, and short-term performance. For that we need
Building a Screener
What I look for
- Liquidity - that means money, or trading volume.
- Room to move - no overhead resistance
- Favorable trends - stable moving averages
- Good short term signals - a good intraday chart
Filters
- Market Cap 300M to 2B
Not too big, and not too small
- Perf 10Y > Perf 5Y
No long term dips in performance
- Perf 5Y > Perf 1Y
No short term dips in performance
- SMA(300) < Price
Price above moving average
- SMA(200) < Price
Price above moving average
- Avg Volume 10D > 100K
No lightly traded stocks. Liquidity needed
- + SMA(200) >= SMA(300)
Stacked long-term SMAs
- + SMA(50 >= SMA(200)
Stacked short-term SMAs
- + ROE, Trailing 12 Months > 0% (Chris Mayer)
Improving ROE
Examples
- SENEA
- DGII
Review the charts
- Verify short term performance
- Multi-VWAP (1 hr Chart) - Free Indicator
- Above a rising 5-Day AVWAP
- Magic Order Blocks (5 min Chart) - Free Indicator
- No major overhead resistance
- Verify fundamentals and long term performance
- ROE (Quarterly) - TV Indicator
- Rising ROE
- Float Shares Outstanding - TV Indicator
- Lower float means lower supply. When high demand occurs, this can act as a price catalyst.
- Multi VWAP from Gaps - Free Indicator
- Stacked is good
- 3 SMA Ladies - Custom Indicator
- Stacked is good
DodgeCoin - Speed Index is telling me ShortReading the chart
1.Location: Fib + touch AVWAP low
2. Speed Index numbers at top on the High side (red numbers) which means Hard to Move Up.
3. PRS Short signal
4. If we do not get stuck into range and break it downwards , it's Short!
Enjoy! Reading the chart with Speed Index!
LiteCoin-LTC Lesson 15 said Long - This is why!Lesson 15 Methodology chart reading:
1. Fib Location (buyers might enter here)
2. Largest down volume wave (buyers could be in there) with increasing PVR
3. Placed AVWAP at the beginning of the down wave and wait for price to cross upwards, wait for a pull back and a Plutus Long on the pull back.
4. Entry Long on the PRL signal.
Enjoy!
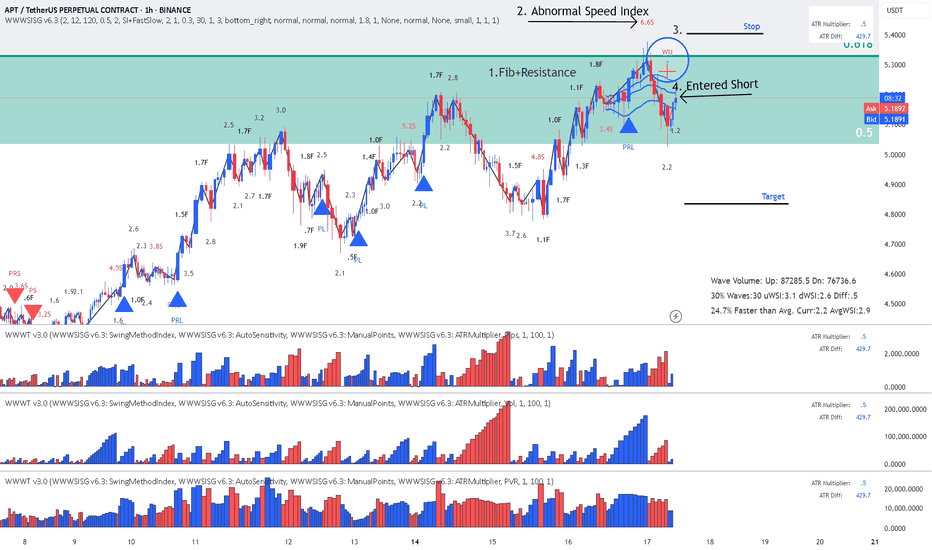
DOGE - Entered Short using Lesson 15 MethodologyThis is how I read the chart using Lesson 15 Methodology:
1. Fib Location (sellers might enter)
2. Sellers started to be visible on PVR when price entered Fib 50-61.8 area and on the break of 61.8
3. FU - Fast Up wave - Fast SI of 3.4F and that's our Fake break of Fib
4. After the false break we have the highest down volume wave, that's another indication of sellers
5. Placed AVWAP at the beginning of the fast wave and wait for the price to cross downwards, then pullback and respect AVWAP as resistance.
6. Entry Short of PS (Plutus Short) signal
I have already moved my order to Break-Even because are entering another Fib location.
I hope this helps. Enjoy!
How to read Speed Index and Identify Potential Reversals!In this chart we removed all Plutus signals and we are reading just Speed Index and weighted Averaged Speed Index. The purpose is to identify a potential reversal at a significant location such as Fib.
There are two numbers visible on every price wave swing, the first one is the wave's Speed Index and the second one is the weighted average Speed Index of the 30 waves back.
What do we need to identify for a potential reversal? The answer is Abnormal Speed Index compared to the weighted average Speed Index, which means that something is cooking.
Reading the chart:
- Look at highest volume up wave hitting the Fib area, Speed Index at 6.2 while the average at 5.0 , higher than the average but not too abnormal.
- The next down wave is where it gives you an Abnormal Speed Index of 10.4 with an average of 5.2. This is what we call their first Push Down, now definitely something is cooking.
- The next up wave has a Speed Index 10.4 (Abnormal) with an average of 5.2 and that's we call a Hard to Move Up Wave (HTMU).(by coincidence these two waves have the Speed Index and average Speed Index)
- Finally to make sure that all these were sellers we need price to break these waves.
To Summarize this is how we approach this Short trade (annotations are in sync with chart).
1. Fib Location (potential sellers might enter)
2. The highest volume up wave to get to Fib
3. Placed AVWAP at the beginning of this up wave, because we will go short if price goes below AVWAP with the appropriate Speed Index justification.
4. First Push Down wave with SI 10.4 with AvgSI at 5.2
5. HTMU (Hard to Move Up) wave with SI 10.4 with AvgSI at 5.2
6. Our entry Short breaking the structure of the previous waves and cross AVWAP downwards.
I hope this helps all you Weis Wave Speed Index owners. Enjoy!!!
LiteCoin -LTC - Lesson15 Methodology Signaled LongChart reading using Lesson 15 methodology:
Annotations in sync with chart
1.Location : Fib 50-61.8 are (an area that buyers can step in)
2. Fast Down Wave with SI 10.9
3. Placed AVWAP at the beginning of fast down wave and wait for price to cross upwards and pull back to it.
4. Wait for a Plutus Long signal to enter and in this case it was a PL.
Enjoy!


