FX - CAD/CHF - GANN FANs Chart !! LONGHello trader,
Nice Week and profitable deals 💲
CAD/CHF 8H Chart 🗝
In this chart we can see 2 gann fans and
1Cloud ☁
Fibretracement 🌊
and MA 200 that gives the bull power, MA50 and 🔑AVWAP
Momentum what the direction shows us up 📈👀
and rsi, with divergences up 💹
Brief explanation of the Gann fann 👀
The lines act as support and resistance, everything under the red area is considered bears‼
SL, TP is visible in the chart 🗝🗓
I would like to mention that all i post are just options and my own opinion!
Always Trade With Sl, And Not Risk More than 1% of your portfolio (max 3%) by trade.
If you have any questions, let me know
➡️If you like my posts smash the Like Fur, Comment or Follow me.⬅️
Thanks for reading my ideas,
Trade save !!
Avwap

BTCUSDT 1HR WK #15I am still in favor of this narrative. Using TTM Squeeze VSA & AVWAP the lack of conviction in the charts MM not favoring lower prices currently.... but volume still hasn't rolled in with price well under the lower band of the AVWAP.
Invalidation: print of 1 hr doji candle followed by high spread/high volume candle to the downside & TTM failure to cross 0 line by open NY session

SPY QQQ DIA VIXY possible intraday targets and analysisMarkets are trying to consolidate and rally to higher highs on the daily chart - but running into resistance at this moment on the intraday levels. Possible upside and downside intraday targets are discussed.

Multi Time Frame analysis SPY DIA QQQ VIXYBuyers took control in the afternoon but did not close out strong.

Analysis of DIA, QQQ, SPY, VIXYLong term markets are still long, but price action and VWAP analysis is showing weakness today and yesterday which may roll over into a further correction down in price. The VIX is a little less bearish about market direction on an intraday basis.
My bias is down or sideways. There is an increasing amount of resistance to the upside and not a lot of base building to move through up through the resistance IMO.

SPY gap down intraday analysis and possible scenarios.SPY sellers have been in control since March 29, and today finally hammered the SPY down below a significant support daily chart support level - finding support at the AVWAP drawn off of the March 15th Fed rate hike. I believe the support level that was gapped below today will be tested as resistance in the near future. If it fails off of that support level, I'd expect the SPY to go down and test support at the AVWAP drawn off of the beginning 2021.

SUPRIYA Range BreakoutSupriya had broken out of the earlier range + Above AVWAP of 491 levels can buy now with SL 475

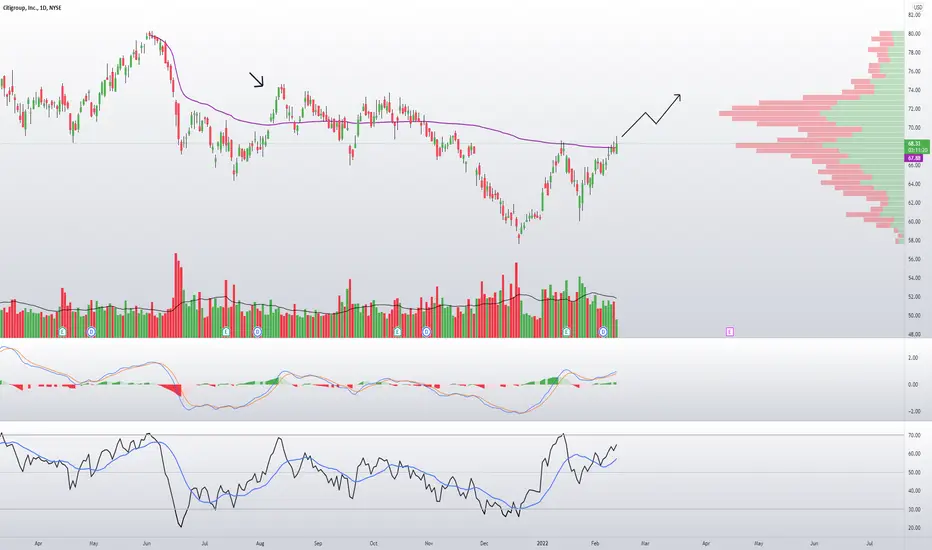
C Citigroup Long IdeaCitigroup recently broke through swing high AVWAP implying a nice chance for more upside.
I'm in May 70/75 Debit Spreads here to play any run up to ER as well.
Looking for a move similar to AUG price action .
Rejection at AVWAP invalidates the trade . Emergency FED meeting and rate headwinds, along with Russia and Covid - keeping positions small and respect stop losses !
QQQ AVWAP BandsAnalyzing the QQQ using multiple SD bands of AVWAP anchored to the COVID bottom. These bands have provided excellent S/R levels.

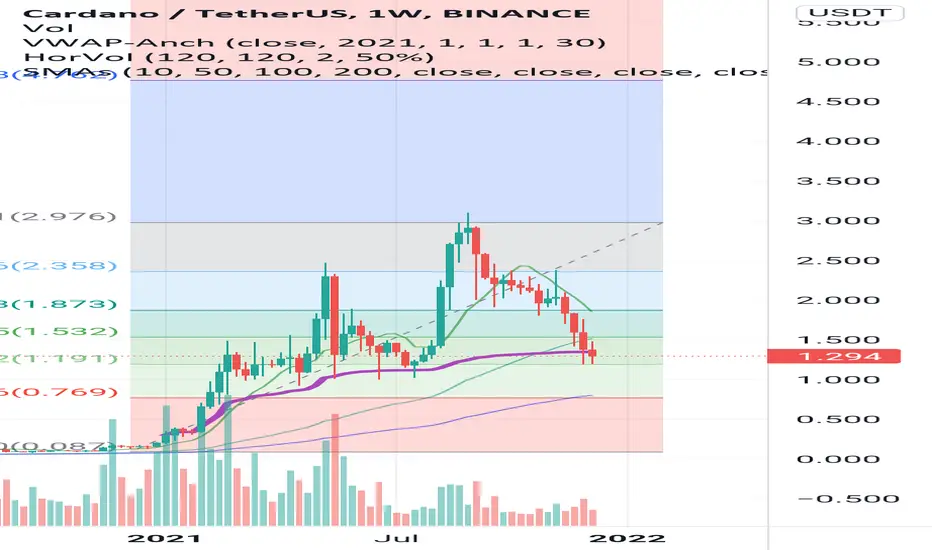
ADA is really under-value at this moment Hello traders
Today once again ADA is touching important averages.
If you are interested for buying this token, right now is one of the best levels with really good RISK:REWARD Ratio. It can touch 4.50 usd in mid-term
As always, do your DD and follow me for news and more.
Thanks for reading.
$ICP to $100BINANCE:ICPUSDT trying to break key resistance level.
The price is approaching AVWAP formed since it appeared on the market (pink line) and for the 4th time it's trying to break key $70 level. Next stop is $100.

$BA Boeing FlyingI'm long JETS so no trade for me here, but a good potential idea would be to trade the move to the AVWAP $236. Nice falling wedge breakout . Earnings 10/27 so keep that in mind for any option trades.

$PENN Weekly swing ideaPenn on the weekly pretty bullish set up from a technical perspective for a swing trade going into EOY.
Nice base forming with a weekly close at the 21EMA, however strong resistance zone $84-86 .
Want to see a break of this, followed by possible retest similar to DEC 20 price action before continuing to the upside.
Failed break of resistance zone invalidates trade and look for a move back down to $70
Momo has my bias to the upside given overall market stays in line.

Aftermath of the Powerful BTC Move from 53k to 42kBTC's move is powerful with a lot of volume. Though we got a decent reaction this is not bullish in my eyes. We've swept all the lows highlighted in green. Moving like a boss GP to GP. Looking for a move to the confluence of resistance at 49k. After that we can evaluate how the strength in the market is, if monthly open can then hold it would be bullish potentially to consolidate higher, in terms of healthy structure to me it makes sense for us to get another leg down and test the AVWAP band from the lower consolidation. Ideally price should hold 44k if we are to get a test for that in the near term though i think 46k should hold.(edited)

$DIS daily (Wyckoff and AVWAP)Disney daily appears to be going through wyckoff accumulation and currently appears to be in Phase D before Phase E breakout.
Retest of AVWAP, now we go.
Looking for the volume shelf/AVWAP to hold, otherwise invalidates the trade.
$188 Alarm for entry

$FUBO weekly$30.16 is YTD AVWAP. On watch for this week for a break of the channel.. MACD looking tight

NO matter where you anchor vwap from no matter which way you anchor it seems bearish continuation in the absence of a catalyst from an Avwap perspective

$V Sellers ExhaustionThis week bulls need to defend the AVWAP level at 222.47
Sellers may be exhausted here and a reversal is implied looking at historic similar volume and price action. However, break below could see 215/210 zone as next level of strong support. Would be backing up the truck and loading longs if we get a chance that low.

$PLTR WeeklyPalantir looks good if we can see a break with volume above the $25.59 AVWAP.
OBV indicator bullish and I like the 8EMA crossing the 21MA indicating a further move to the upside.
I'm long the 9/17 $26C , will close if there is rejection at the AVWAP due to timing.


$LCID Important Levels to WatchAfternoon Everyone!
It is just and update on my last two posts on NASDAQ:LCID .
I have intentionally excluded Moving Averages on the chart this time as we all have an idea what and where they are. Currently NASDAQ:LCID is trading below the 50 SMA. Which is a bearish spot in short term.
Having said that, I think the stock has an upward potential. It might be forming a Neutral Wedge in short term. For an upward break though we need to watch the 4 AVWAP lines on the chart marked as red. This is along the thesis that I had previously. We need to deal with these lines to break out of the wedge.
I hope the update helps you all next week. Have a great weekend.
Thanks!

$LCID A follow up on Lucid MotorsCongratulations to all who have been trading NASDAQ:LCID on the first day! This write up is a mid-day follow up on the idea that I posted yesterday on CCIV or LCID.
So far NASDAQ:LCID has successfully broken the Anchored VWAP around $25.15 price level. In the morning session it broke above AVWAP's at $27.32 and $28.80 levels but could not stay above them. It will be crucial for LCID to break above these two levels tomorrow (or even in the Afternoon session) if we are looking into price targets such as $32.72 and above.
It is also a good sign that the stock is trading above the 21 day EMA and AVWAP's from both recent high and low. Technically, all 3 of these value areas should work as support in coming days. The progressive increase in Volume in last couple of days is also an important indicator to consider.
I hope this helps you all with the perspective and making good trading decisions.
Thanks!

CCIV / LCID After Merger: Bullish Hammer Above 50MA and AVWAPThe merger between NYSE:CCIV and LCID has been approved today and the stock will trade under LCID from Monday.
A classic Bullish Hammer candle has formed taking support on the 50 day SMA and the AVWAP (Anchored VWAP) line anchored at the base since the merger was announced. Still the ticker is trading below AVWAP lines from the recent high, all time high and the first ever significant hike in January this year.
In my humble option, LCID needs to deal with these important resistances at $25, $27.40 and 28.90 price levels if we are hoping for a significant run. So far the Bullish Hammer above the above mentioned support levels is a good start. It has also broken out of the downward trend line that it has been following since the recent high.
Let's hope for the best! Also please let me know your opinion on it.
Thanks!
