Axis BAnkAxis Bank has heavy support if bank nifty index bullish then also bullish axis bank on Wednesday and high probably chance to bank nifty open in bullish
AXISBANK

breakout after a consolidation here we can see a good consolidation forming on the resistance level which means the sellers are getting weak so this could result in a good breakout. best of luck

Axis_bank_intradayWEdge breakout and so expecting this move eventually. Chk it out. Lets see the outcome


AXIS BANK Swing TradeAXIS BANK is forming a triangular pattern as well as inverse head & shoulder pattern. Price is expected to reach above 760-770.

AXISBANK LONG INTRADAY 24 MAY,2021Dear trader,
If u look at the chart of AXISBANK (analysis based intraday only) the AXISBANK Buy at 730 and Target at 745
Best Buy at 728.
Our Best Buy is based on high quality research and when the instrument reaches this level , it’s a jackpot trade.
Best Buy level might be executed or might not be executed.
The chart clearly indicates Bullish Trend you can also see the candle stick patters for more indepth analysis.
In Intraday most important thing is to enter and exit points.
Our signals are based on analytics, algorithms, mathematical derivatives.
Always be a responsible trader, kindly trade only when you have maximum opportunity in the market with minimum risk and with keynotes like data, analysis and proper strategies.
Kindly message us for strategies and analysis.

Axisbank Axisbank looking in Bullish impulse started
One can go Long now or in dips with stoploss of 704
All the key levels are mentioned in chart with Stop-loss and Targets.
Head and Shoulder Pattern Neckline Breakout
Impulse Started
Macd in daily time frame positive and Uptick
Macd in hourly time frame positive and Uptick
Rsi in daily at 59 along with Uptick
Rsi in hourly above 60
Upper Bollinger Challenged in Hourly
DMI and adx positive attitude
Disclaimer
I am not sebi registered analyst
My studies are Educational purpose only
Consult with your Financial advisor before trading or investing

Bullish Reversal On Weekly Chart Of Axis Bank.NSE:AXISBANK
Last week (17th May 2021) closing of AXISBANK weekly candle indicating good reversal or one can even say beginning of up move after retracement.
If we get any follow through to this weekly candle even on daily chart its will be good confirmation for AxisBank to be making new lifetime high.
For short term or long term investors AxisBank have good support near 560-530.
As far as targets are concerned I always prefer to use Fib Extension tool when there is no background remain for any stock. And as per Fib Extensions level of 1.618 AXISBANK may reach 1270 within a period of 3-6 months.
Thanks for Reading and sorry there is not much to say in this chart. Its looks too simple.
|| Hari Om ||

AXIS BANK :: BULLISHDATE: 19 MAY 2021
INSTRUMENT: AXISBANK
TREND: BUY
TIME FRAME: day
CMP: 716.80
BUY ABOVE: 725
STOP LOSS: 700
TGT 01: 760
TGT 02: 790
DISCLAIMER:
We are not S E B I registered analysts. Please consult your personal financial advisor before investing. We are not responsible for your profits/losses whatsoever.

Axis BankImportant levels are marked in chart. build up and trend in long side, dips are to be used for long entry in staggered manner.


AXISBANK All the key levels are mentioned in chart with Stop-loss and Targets
Disclaimer
I am not sebi registered analyst
My studies are Educational purpose only
Please consult with your Financial advisor before trading or investing

Axis bank (Make or break levels)As we know rising of Coronavirus cases in India is affecting banking stocks the most.
has a very strong support around 628 to 630 and it just showed sign of reversal. Although with increasing cases of Corona virus can bring to stock down again to 628 levels and provide a shorting opportunity as well.

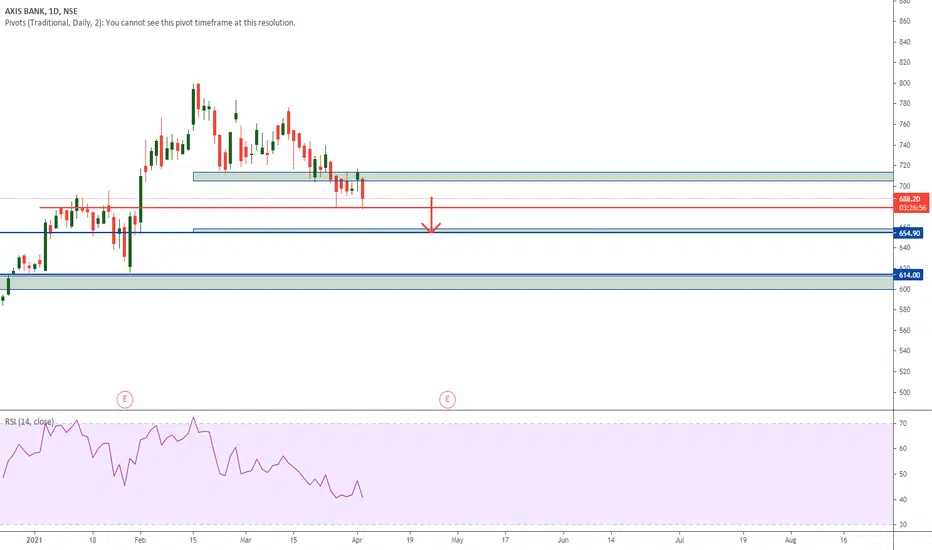
axis bank (sensex) hi there i see this are price react a weakness from this level. so my obserbesion says market go down lower from this level. till 654 stay tune with me for next update
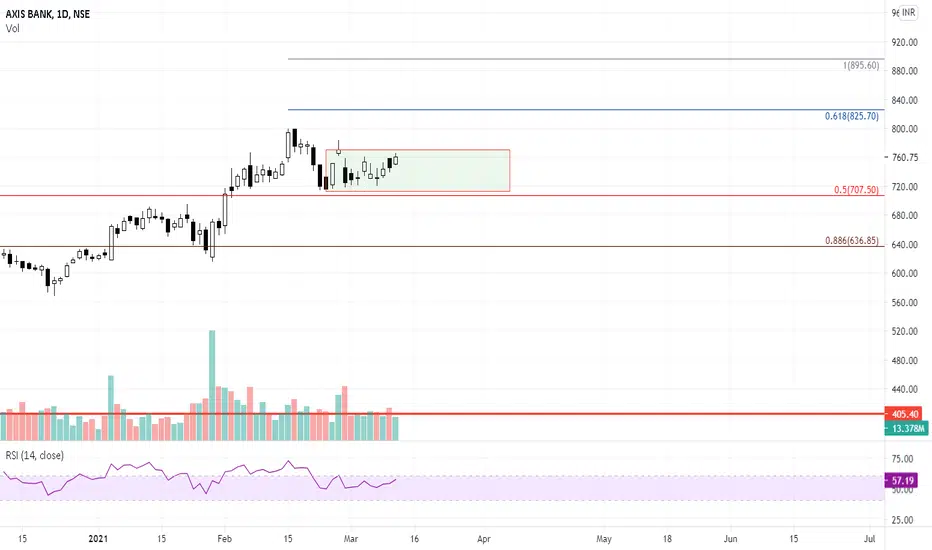
AXISBANK - Trading in a RangeAxisbank - This Range breakout will decide the further trend in the stock.


AXIS Bank ShortAb=CD and XABCD, FIB Projection and Reversal confirmed.
SL is 800
Tgts are 725 and 700


My Analysis | Provide me insights where I am Wrong ? What I have done and What I believe -->
I have analyzed this chart on the basis of supply-demand and SR lines.
I have used RSI and Parabolic SAR and I am hoping the price will not bounce from the upper level, Because this level of demand served 3-4 as demand level in previous months and most probably it will serve the Demand area Also.
Please tell me where I am wrong and provide me positive feedback.

