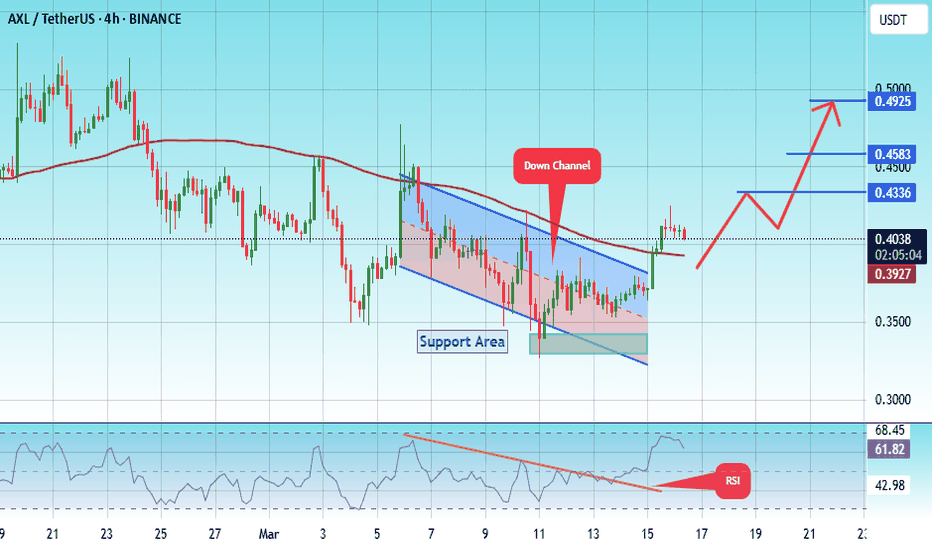
#AXL/USDT#AXL
The price is moving within a descending channel on the 1-hour frame, adhering well to it, and is heading for a strong breakout and retest.
We are experiencing a rebound from the lower boundary of the descending channel, which is support at 0.3360.
We are experiencing a downtrend on the RSI indicator, which is about to break and retest, supporting the upward trend.
We are looking for stability above the 100 Moving Average.
Entry price: 0.4040
First target: 0.4336
Second target: 0.4580
Third target: 0.4925
AXLBTC
Axelar 231% Potential —Keeping It SimpleThe left side of the chart is the consolidation range. The red channel comes from a breakdown of support. This is not a bearish impulse but a breakdown of support. This is revealed by the structure of the chart and the trading volume.
Since support broke down, the next logical step is for AXLBTC (Axelar) to test previous support as resistance. This indicate a move back to baseline, this is the minimum. The baseline being a ~60% up-move.
The resistance level will break then Axelar will end up moving higher, much higher...
Additional details and a higher target can be found mapped on the chart.
Thank you for reading.
Namaste.
#AXL/USDT#AXL
The price is moving within a bearish channel pattern on the 4-hour frame, which is a strong retracement pattern
We have a bounce from a major support area in green at 0.5000
We have a tendency to stabilize above the Moving Average 100
We have a downtrend on the RSI indicator that supports the rise and gives greater momentum, upon which the price is based higher at the discount
Entry price is 0.5720
The first target is 0.7670
The second target is 0.9000
The third goal is 1.05
AXL 8R Trade Idea with Entry, Targets, and Stop LossAXL is down from entry and has tagged the previous weekly entry that sent price down 32% and then up 500% (47 cents entry to 32 cents low, and finally a rally to $2.7). Price has retraced this move back to the previous entry of 47 cents AND made another weekly entry at 57 cents.
Targets based on the risk from that entry have been drawn.
Yellow Stop loss of -20% is based on previous lows.
Orange stop loss of -33% is based on how low price went after the previous weekly entry of 48 cents before the rally (-32% from weekly entry)
AXL ANALYSIS (4H)From where we entered "START" on the chart, AXL correction seems to have started.
This correction seems to be a diametric.
Now it seems that AXL intends to complete the F wave of this diametric.
It can move from the green range of demand to the red range of supply.
Closing a daily candle above the invalidation level will violate the analysis.
For risk management, please don't forget stop loss and capital management
Comment if you have any questions
Thank You
#AXLUSDT#AXL
We have a bearish channel pattern on the 12-hour frame, within which the price moves and adheres to its limits well
We have a green support area at 0.800 after the price touched it and bounced from it
We have a tendency to stabilize above moving average 100
We have a downtrend on the RSI indicator that supports the price higher with a breakout
Entry price is 1.00
The first goal is 1.19
The second goal is 1.33
the third goal is 1.52
AXL ANALYSISAccording to the structure of the waves, it seems that AXL is in wave D of a larger pattern.
The green area is the place of buy/long positions and the red area is the place of sell/short positions.
For risk management, please don't forget stop loss and capital management
Comment if you have any questions
Thank You


