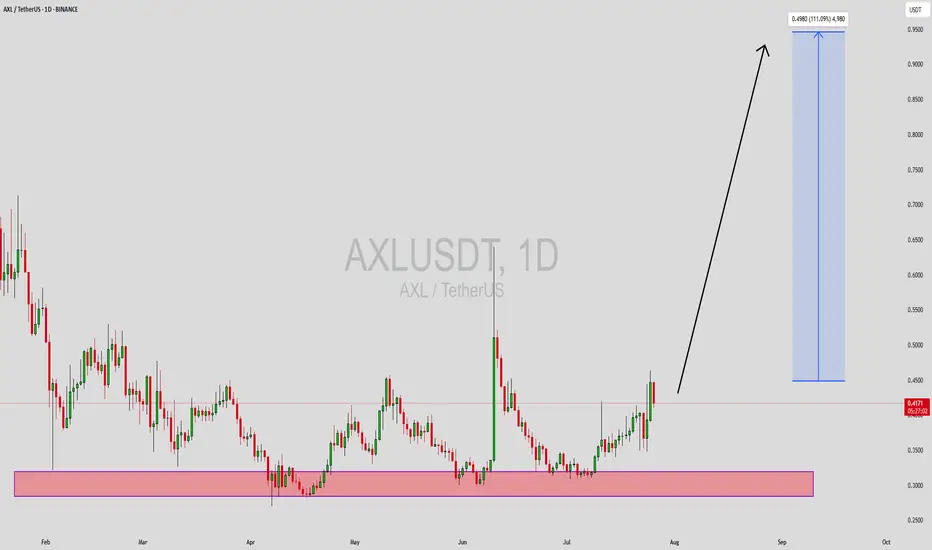
AXLUSDT Forming Bullish ReversalAXLUSDT is showing clear signs of a bullish reversal pattern on the daily timeframe, indicating a potential shift in market sentiment from bearish to bullish. This pattern is typically characterized by a slowing of downward momentum followed by a breakout to the upside, and AXL is currently forming higher lows—often the early signal of a trend reversal. The current price action suggests accumulation, and with increasing volume behind the recent moves, we may be on the verge of a significant breakout.
This technical setup is further strengthened by improved market structure and growing interest from traders and investors alike. The volume profile shows increasing participation at current levels, a strong indication that smart money could be stepping in. With bullish momentum building and the price reclaiming key support zones, the technical target points toward a 90% to 100% upside potential in the coming weeks.
AXL has been under the radar, but that may not last much longer. The project fundamentals are solid, and with market participants beginning to recognize the recovery potential, a trend shift seems imminent. As more traders start to identify this bullish reversal, we could see a rapid increase in price, especially if it breaks above resistance with strength.
Traders should keep a close eye on volume confirmation and price behavior around key levels to catch the breakout early. If momentum continues to build and resistance is flipped into support, AXLUSDT could deliver one of the stronger moves in the mid-cap altcoin space this quarter.
✅ Show your support by hitting the like button and
✅ Leaving a comment below! (What is You opinion about this Coin)
Your feedback and engagement keep me inspired to share more insightful market analysis with you!
AXLUSDT
Axelar finding support if not get outAXL is now within a clearly defined range. At the bottom of the range, the RR is at its best. The best part of this range is the amount of volume. This suggests the market is participating here.
Full TA: Link in the BIO
Altcoins Market Bull Market Confirmed, AxelarThis is the same chart as Ravencoin; These are the same price dynamics and awesomely, the same results.
Good morning my fellow Cryptocurrency trader, this is a wonderful day because the altcoins market bull market is already confirmed, let me show you some more proof.
I used first Ravencoin as an early signal showing that the 2025 bull market is here, strong long-term growth; a bullish continuation, a new advance, higher prices next. The biggest bullish wave and bullish action since 2021 for the entire Cryptocurrency market.
Here is the pattern again explained:
1) There is a rise in late 2024, it lasted only one month from November through December. This coming off the August 2024 market bottom, when Bitcoin produced a flush.
2) The December 2024 high leads to a strong correction. This correction has three stop points. 3-Feb. mid-March and 7-April. 7-April marks the bottom for most pairs with the usual variations.
3) An initial recovery from the 7-April 2025 low leads to some growth. Some pairs grew 100-300% while others grew 30-60%.
4) This recovery gets corrected and ends in a higher low.
5) This higher low signal the start of the next advance, very strong bullish action. This is what you see on the chart.
Axelar (AXLUSDT) produced a very strong bullish breakout, we have more than 90% green on a single day. This is only the beginning, and many altcoins will be doing the same. Literally hundreds of altcoins will perform like this in the coming days.
The bull market is here and already confirmed.
It is still early, choose wisely.
Some will move now while others will continue lower.
Some will move but it will take months before they turn green.
Take your time looking at the charts and making your choice, choosing correctly means everything. It means the difference of winning daily and big vs staying holding something doesn't that doesn't grow.
If you agree make sure to follow.
If you have any questions, your comments are welcomed below.
Thanks a lot for your continued support.
Namaste.

AXLUSDT Forming Descending Wedge bullishAXLUSDT is currently showing strong bullish signals after consolidating at a significant support level, with a notable uptick in trading volume. This renewed volume interest often precedes a breakout move, and the technical structure is shaping up for a potential surge. With momentum building and price action tightening, a projected gain of 60% to 70% is realistically within reach in the short to mid-term. This aligns well with historical price behavior and upcoming support-to-resistance flips.
Axelar (AXL) continues to attract investor interest due to its foundational role in cross-chain communication and interoperability. As more blockchains develop in silos, the need for protocols like Axelar grows. Its ability to facilitate seamless transfers across multiple chains makes it a strong contender in the next wave of infrastructure-focused crypto projects. Market participants are increasingly positioning themselves in utility-driven tokens like AXL that solve real scalability and connectivity problems in DeFi and the broader crypto ecosystem.
From a technical perspective, AXLUSDT is forming a bullish continuation pattern, suggesting that the recent consolidation is simply a pause before another impulsive leg to the upside. The presence of strong support zones, combined with increased volume and investor sentiment, makes this a high-probability setup for breakout traders and swing investors alike. If bullish momentum continues, the upside targets fall well within the 60% to 70% projected gain range.
Traders should keep a close watch on breakout confirmation signals and volume spikes, which could mark the start of a sustained bullish rally. As adoption and attention around cross-chain solutions grow, AXL is likely to see further market traction and price appreciation.
✅ Show your support by hitting the like button and
✅ Leaving a comment below! (What is You opinion about this Coin)
Your feedback and engagement keep me inspired to share more insightful market analysis with you!

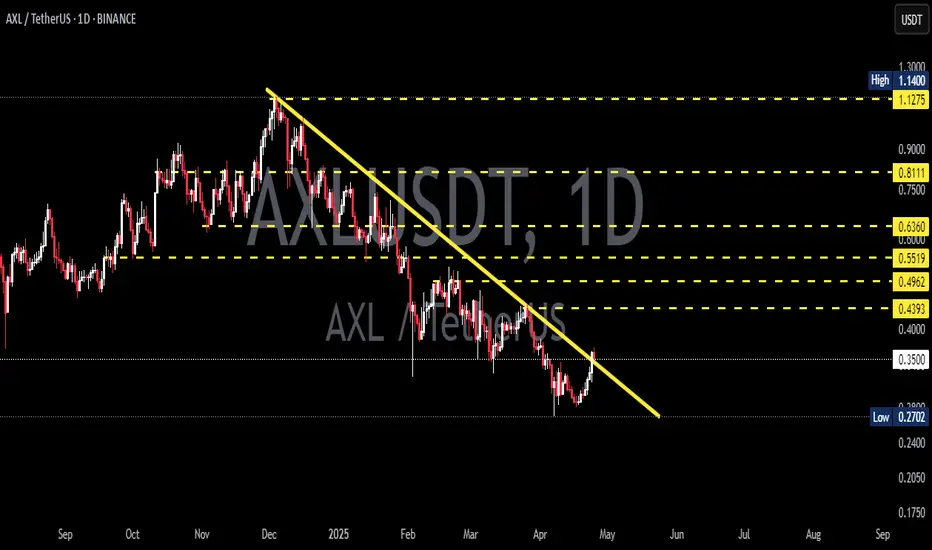
AXL/USDT – Falling Wedge Breakout! Time to Ride the Wave!!🚀 AXL Breakout Alert – 100% Potential Incoming?! 👀🔥
Hey Traders! If you're all about high-conviction plays and real alpha, smash that 👍 and tap Follow for more setups that actually deliver! 💹💯
AXL has broken out of its long-term falling wedge pattern on the daily timeframe—this is a strong reversal signal and could set the stage for a big move ahead! 🔥
🟢 Entry Zone:
CMP (Current Market Price)
Add more up to: $0.38
🎯 Targets:
🎯 TP1: $0.515
🎯 TP2: $0.634
🎯 TP3: $0.751
🎯 TP4: $1.007+
🛡️ Stop Loss: $0.325 (below wedge support)
💡 Insight:
This breakout is aligning with the overall bullish momentum we're seeing in the altcoin market. Watch for a healthy retest of the breakout zone to confirm strength. 🚀
📊 Risk Management Tip: Start taking partial profits at each target and trail your SL to lock in gains.
Let’s ride this breakout smartly! 🔥

AXLUSDT 1D AnalysisAXL ~ 1D Analysis
#AXL Managed to penetrate this resistant line and is currently trying to maintain it. As long as the price is above this S/R line, bullish can still encourage prices.
Trading opportunity for AXLUSDT AxelarBased on technical factors there is a Buy position in :
📊 AXLUSDT
🔵 Buy Now or by Breakout
🪫Stop loss 0.3600
🔋Target 0.4950
📏 R/R 2,5
💸RISK : 1%
We hope it is profitable for you ❤️
Please support our activity with your likes👍 and comments📝

#AXL/USDT#AXL
The price is moving within a descending channel on the 1-hour frame, adhering well to it, and is heading for a strong breakout and retest.
We are experiencing a rebound from the lower boundary of the descending channel, which is support at 0.3360.
We are experiencing a downtrend on the RSI indicator, which is about to break and retest, supporting the upward trend.
We are looking for stability above the 100 Moving Average.
Entry price: 0.4040
First target: 0.4336
Second target: 0.4580
Third target: 0.4925

AXLUSDT 1DAXL ~ 1D Analysis
#AXL High risk trading, Buy after successfully penetrating this resistant line or buy after successfully testing this support block. with a short -term target of at least 10%+.

AXLUSDT 2DAXL ~ 2D Analysis
#AXL Test this support, buy from here if you still have a Conviction on this Coin with a minimum target of 15%+

#AXL/USDT#AXL
The price is moving within a bearish channel pattern on the 4-hour frame, which is a strong retracement pattern
We have a bounce from a major support area in green at 0.5000
We have a tendency to stabilize above the Moving Average 100
We have a downtrend on the RSI indicator that supports the rise and gives greater momentum, upon which the price is based higher at the discount
Entry price is 0.5720
The first target is 0.7670
The second target is 0.9000
The third goal is 1.05

TradeCityPro | AXL : Steady Uptrend & Potential Breakout Ahead👋 Welcome to TradeCityPro!
In this analysis, I will review AXL, the token of the Axelar project, which serves as a Crosschain platform and also features a blockchain explorer.
📅 Daily Timeframe: Uptrend and SMA Slope Change
On the daily timeframe, we observe a steady and gradual uptrend with a low slope. A clear ascending trendline is also visible, which has been tested by the price four times so far.
📈 The token has broken out of its box’s ceiling at 0.8318, but it hasn’t started its main bullish movement yet. A pullback to this level has occurred, and if 1.1281 is broken, the price could initiate its primary upward wave.
👀 Apart from the 1.1281 resistance, there is another significant resistance at 1.2781, located near this zone. Thus, the range between 1.1281 and 1.2781 forms a strong resistance zone, and breaking above this area could mark the start of the uptrend.
🧩 Given the upward slope of the SMA99, I believe we will soon see its influence, pushing the price higher.
🚀 If this zone is broken, the next targets are 1.6587 and 2.2828, with the second target being close to the ATH.
📉 Correction Scenario
In the event of a correction, the first key area is 0.8318, which has already been tested once and held firm. For deeper corrections, the initial zone to watch is the ascending trendline, and if the trendline breaks, 0.6386 becomes the next notable support.
📝 Final Thoughts
This analysis reflects our opinions and is not financial advice.
Share your thoughts in the comments, and don’t forget to share this analysis with your friends! ❤️

AXL prepares for key level breakoutAXL is a unique project to connect multiple networks. Now its price is quite attractive! There was a consolidation above the 50 EMA, the price continues to move to the level of 1.0872$, which is the key level. If this level is broken, we will see an incredible growth. My target at the 4$+ MACD area also signals the strength of the bullish trend!
Horban Brothers.

Trading opportunity for AXLUSDTBased on technical factors there is a Buy position in :
📊 AXLUSDT
🔵 Buy Now
🪫Stop loss 0.7200
🔋Target 1 0.9900
🔋Target 2 1.3000
🔋Target 3 1.9500
💸RISK : 1%
We hope it is profitable for you ❤️
Please support our activity with your likes👍 and comments📝

The Banana Zone Series - AXL Buy the Dip Levels (10 of 10)Alt-season is here. BTC breakout has been confirmed. If you missed positioning for the next level of exponential moves, what are some of the buy the dip zones while still have time for the bigger moves into the banana zone.
We continue the series with Axelar ( NYSE:AXL ).
As you can see in my analysis, pull backs to $0.7397 and below is my new accumulation zone. I will initiate some leveraged longs for new trades in preparation for the moves to the banana zone in the alt season.
For more aggressive traders, $0.76 and below can be the trigger longs with tight stops.
Not a financial advice so DYOR.

#AXLUSDT Getting Ready for a Massive Breakout | Get ReadyYello, Paradisers! Is #AXLUSDT about to break out and deliver a massive rally? Let's discuss the latest analysis of #Axelar and see what's happening:
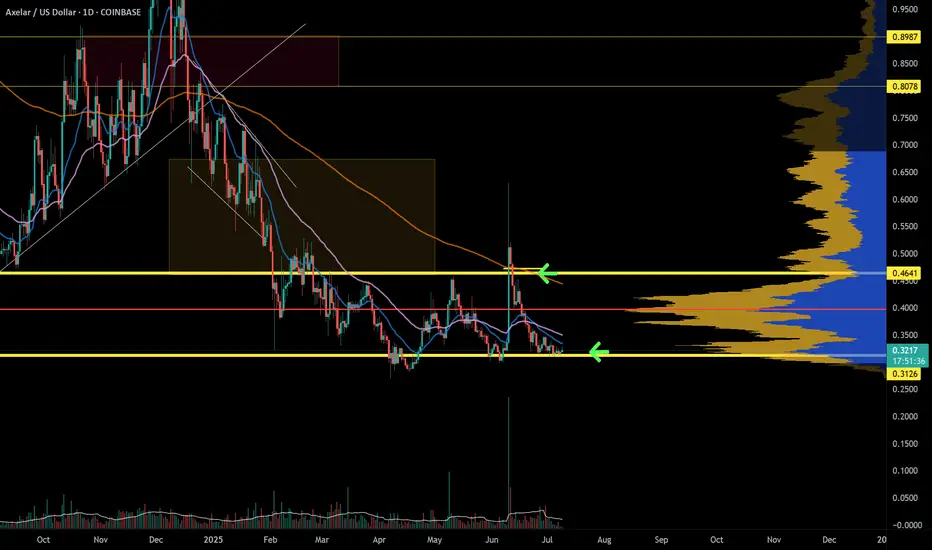
💎#AXLUSDT is showing promising signs of a bullish continuation after a strong push from the critical support level at $0.463. We’ve been keeping a close eye on #Axelar’s movement within a Descending Broadening Wedge pattern, and now it’s making an attempt to break above the descending resistance line.
💎If #AXL can maintain strength at this level, we could be on the brink of a major rally, mirroring previous bullish trends. A clean breakout above the key resistance zone at $0.692 might open the door to even higher resistance levels—and possibly new highs.
💎But here's the catch: Caution is key. If momentum fades around this critical support, we might see a pullback toward the lower demand area near $0.368-$0.405.
💎A daily close below this demand zone would invalidate our bullish outlook and could signal further declines ahead for $AXL.
Stay vigilant, Paradisers, and keep a close eye on #TOKEN's price action.
MyCryptoParadise
iFeel the success🌴

AXLUSD - 4h Consolidation ZoneAXLUSD - 4h Consolidation Zone
If you like my AT, and you agree with the approaches, please FOLLOW ME and press BOOST so we can share it with more people. We are working on an automated trading tool so that everyone can apply their strategies in a VISUAL and PROFESSIONAL way, as we present in the analysis.
Thank you!
_______________________________________________________
AXLUSD - 4h Consolidation Zone
AXL broke strongly from 0.40 which we marked as dynamic support and is now trading at 0.81
It is possible that the price will test 0.75 before developing a new momentum that leads the value to seek 1.11.
LEVELS:
SL: 0.75
TP1: 1.11
TP2: 1.31
Part of its development will have to do with what btc does, but it seems that October will continue to be a BULLISH month.
______________________________________________________
Automated Cryptocurrency Trading Bots: All these strategic alternatives can be configured with TradeX BoT, since it will allow you to position in both directions without having to block any amount per position. It will only be necessary for the conditions to be met, either downward or upward, for the orders to be executed in one direction or another, taking the necessary deposits from your portfolio.
TradeX BoT (in development): Tool to automate trading strategies designed in TradingView. It works with both indicators and technical drawing tools: parallel channels, trend lines, supports, resistances... It allows you to easily establish SL (%), TP (%), SL Trailing... multiple strategies in different values, simultaneous BUY-SELL orders, conditional orders.
This tool is in the process of development and the BETA will soon be ready for testing.
FOLLOW ME and I will keep you informed of the progress we make.
I share with you my technical analysis assessments on certain stocks that I follow as part of the strategies I design for my portfolio, but I do not recommend anyone to operate based on these indicators. Inform yourself, train yourself and build your own strategies when investing. I only hope that my comments help you on your own path :)

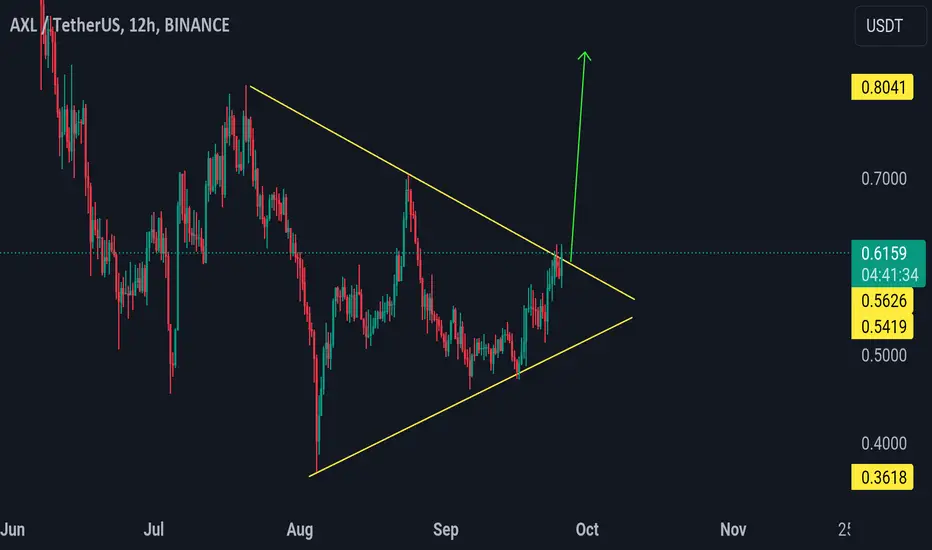
AXL/USDT Potential Breakout AheadAxs/USDT is showing potential for a breakout from a symmetrical triangle pattern on the 4-hour time frame. A solid breakout could happen soon. If the price breaks out and successfully retests the breakout level, we might see a surge of 40-80% in the coming days. Keep an eye on this movement, as it could be significant. This is not financial advice—please do your own research.

AXL still has a great trade set upAXL on pull backs to 0.61-0.65 level presents a great position trade for the long term. I will be accumulating in any pull back. My initial price target is 1.26.
This is a 2 day chart so it will take some time to play out. Wait for the pull backs. Both Market Cipher and my modified MACD looks good for a long trade. This is not a financial advice. DYOR.

AXLUSD 1D - Rises above $0.70AXLUSD 1D - Rises above $0.70
AXLUSD is a stock to watch. It had a continuous rise that took it to a maximum of $2.70. It is now trading at $0.60.
It has already overcome the downward trend and is settling its price to begin a new price escalation. It has to overcome the previous lower high at $0.70 to be ready for a bullish rally.
Before breaking upwards, it could mark a DOUBLE BOTTOM in the $0.40 area. Hence the importance of breaking the $0.70 levels and not losing the dynamic support.
The objectives are clearly marked.
This strategy can be executed with TradeX BoT when we finish developing it.
TradeX BoT (in development):
Tool to automate trading strategies designed in TradingView. It works with both indicators and graphic design tools: parallel channels, trend lines, supports, resistances… It allows you to easily establish SL (%), TP (%), SL Trailing… multiple strategies in different values, simultaneous BUY-SELL orders, conditional orders.
This tool is in the development process and the BETA will soon be ready for testing.
FOLLOW ME and I will keep you informed of the progress we make.
I share with you my technical analysis assessments on certain values that I follow as part of the strategies I design for my portfolio, but I do not recommend anyone to operate based on these indications. Inform yourself, train yourself and build your own strategies when investing. I only hope that my comments help you on your own path :)

AXL/USDT Plan Axl/USDT is currently approaching a potential breakout from a triangle pattern, suggesting that a significant price movement could be on the horizon. If the breakout is successful, I anticipate a bullish trend in the coming days. It's important to monitor key resistance levels for confirmation. Remember, this is not financial advice; always do your own research (DYOR) before making any investment decisions.
AXLUSDT 2DAXL ~ 2D
#AXL We would say Bullish on this Token once it breaks the resistance line of this descending pattern.

AXL 8R Trade Idea with Entry, Targets, and Stop LossAXL is down from entry and has tagged the previous weekly entry that sent price down 32% and then up 500% (47 cents entry to 32 cents low, and finally a rally to $2.7). Price has retraced this move back to the previous entry of 47 cents AND made another weekly entry at 57 cents.
Targets based on the risk from that entry have been drawn.
Yellow Stop loss of -20% is based on previous lows.
Orange stop loss of -33% is based on how low price went after the previous weekly entry of 48 cents before the rally (-32% from weekly entry)
