AXS

🔥 AXS/USDT Steep Drop On The HorizonAXS/USDT is currently inside a megaphone pattern with higher highs and lower lows. Recently, AXS hit the upper resistance of the megaphone and declining in value at an alarming rate.
On the chart I've marked two important areas of support, S1 and S2. Expect either reversal or consolidation around those areas.
Happy trading!


✳️Axie Infinity/USDT Analysis (22/1) #AXS $AXSAXS has retested $0.6 zone many times and still succeeds in closing 1Day candlestick above $0.6 so we can completely believe in this zone and AXS can strongly rally to $1 zone at early February and breaking to $1.4 zone a few days later
📈BUY
-Buy: 0.6-0.63$. SL if B
📉SELL
-Sell: 0.95-1$. SL if A
-Sell: 1.4-1.45$. SL if A
♻️BACK-UP
-Sell: 0.6-0.63$ if B. SL if A
-Buy: 0.45-0.475$. SL if B
-Sell: 0.45-0.475$ if B. SL if A
-Buy: 0.325-0.35$. SL if B
❓Details
Condition A : "If 1D candle closes ABOVE this zone"
Condition B : "If 1D candle closes BELOW this zone"

AXS/USDT Bearish ChannelAXS has been following this bearish channel for over a month now. Yesterday it reversed from the top trend line, signaling a new bearish period for this coin.
I've marked the next two main areas of support on the chart, S1 at $0.5 and S2 at the last bottom respectively.
Happy trading!


AXS/USDT Reversal from Support: Bullish OutlookAXS/USDT has reversed from the down sloping trend line. A few hours ago, the price managed to break through the support around the $0.515 area, marking a new upward trend.
I've marked two areas of resistance, R1 and R2, on the chart. They are based around $0.50 and $0.60, recent areas of interest. Happy trading!

AXS/USDT Possible Trade Opportunity Keep an eye on AXS. A pullback below the trend line is going to be a nice SHORT position. #DYOR

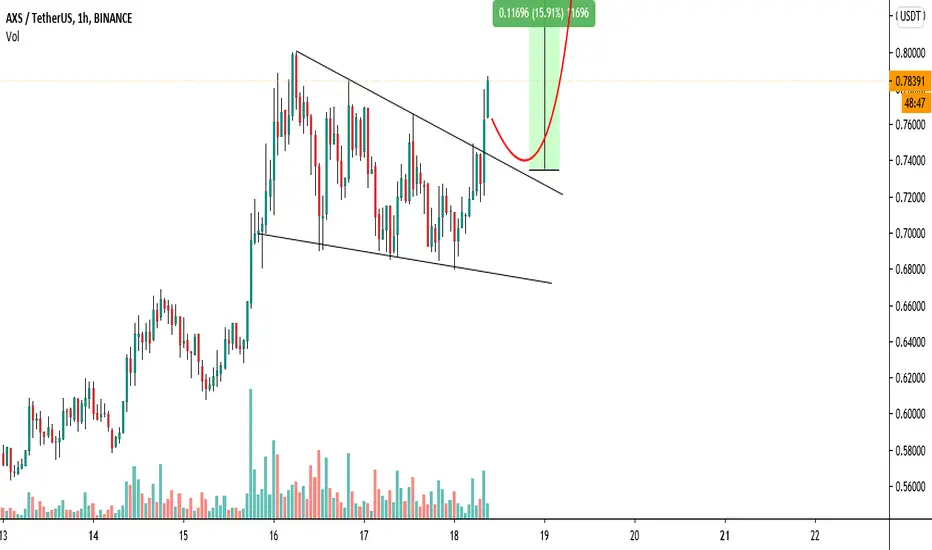
AXSUSDT - Imminent breakout AXSUSDT is consolidating in a symmetrical triangle pattern.
Breakout is imminent.
Possible price actions are indicated on the chart


AXSUSDT forming Cypher | Upto 178% bullish move expectedOn the daily chart, the price action of the Axie Infinity (AXS) token is completing the last leg of bullish Cypher and soon it will be entered in potential reversal zone.
Buying And Sell Targets:
The buying and sell targets as per the Fibonacci sequence of Cypher pattern should be:
Potential reversal or buying zone: $0.3889 to $0.2618
Fibonacci projection or sell zone: $0.4880 to $0.7303
Stop Loss:
The potential reversal zone area that is up to $0.2618 can be used as stop loss in case of complete candlestick closes below this level.
Possible profit and loss ratio:
As per the above targets, this trade has a profit possibility of 178%, and the loss possibility is 33%.
Note: Above idea is for educational purpose only. It is advised to diversify and strictly follow the stop loss, and don't get stuck with trade.


AXS/USDT Bullish Price ActionAXS/USDT saw some amazing price action earlier this morning, bouncing sharply from the support line.
With a lot of alts rising sharply, I think we will see a small rebound towards earlier highs in the coming week.
My targets are Resistance 1 and Resistance 2, since I expect some selling pressure around there. Do your own DD.

AXS Bull Flag Breakoutprice break the bull flag ready to move higher
add ladder position
price also made above ATH in usdt pair 0.68 is support zone
wait for price to touch the retest zone than enter the trade else wait price can touch the main support zone ( 0.68$ ) and bounce again in btc bad move
good buy only 0.7450 - 0.75
AXS UPDATE #3Almost 50% UP since shared days ago, currently price fighting against main resistance at ATH, if we get to close and consolidate above, I will rebuy part aiming for those objectives in chart. If price is not able of closing above, we might see a retest of 3.6K-3.4K area, where I will be looking to buy aiming again for the main ATH resistance, and hoping for a break.


$AXS Crossing above All time high level & into price discovery.$AXS
Crossing above All time high level & into price discovery..
Volume not that strong yet.. so careful fomoing.
If gets traction, then Fib levels as a guide for potential levels to watch.
#AXS

AXS UPDATEShared this trade some days ago, currently in from around 2.9k, I want to see this black line hold for more continuation, for now PA looks really bullish, retesting this last resistance and flipping to support. Once we get above and price discovery starts I will update with my objectives.

