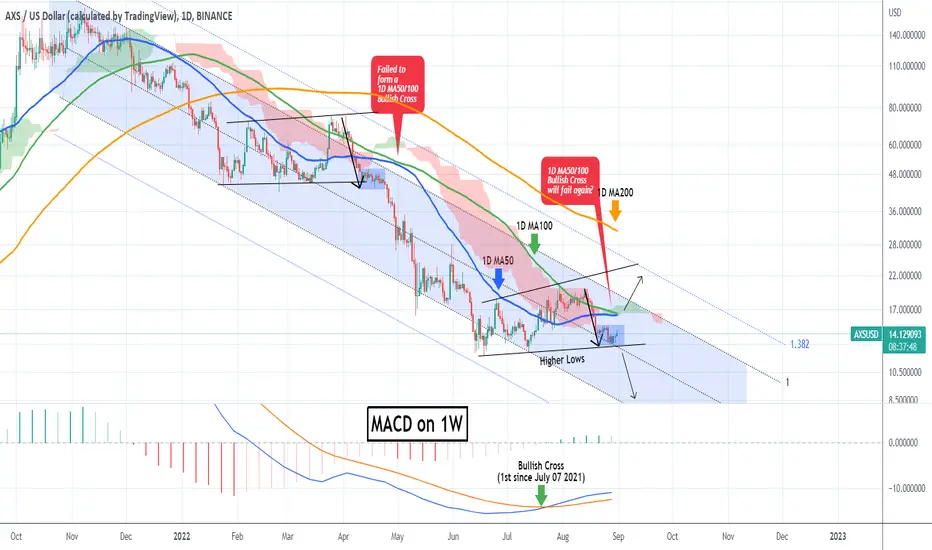
AXSUSD No buy until this level breaks.Axie Infinity (AXSUSD) has been consolidating below the 1D MA50 (blue trend-line) since August 19 2022. This is so far a similar trading sequence to the fractal of April 02 - April 24, where the price dropped aggressively initially before having the consolidation that kick-started the sell-off of April - May.
The current Support as in April, is the Higher Lows trend-line. A failure of the 1D MA50 to cross above the 1D MA100 (green trend-line) would strengthen the bearish bias as it failed also back in April. Also the Ichimoku Cloud has already turned red. As a result, a break below the Higher Lows would be a sell signal towards the bottom of the Channel Down.
However, this time there is a strong indication that long-term bullish accumulation has started. That is the MACD on the 1W time-frame, which is on a Bullish Cross, the first since July 07 2021. This is typically formed before long-term rallies. Therefore, a break above the 1D MA100 can target the Higher Highs trend-line and the 1D MA200 (orange trend-line) in extension.
--------------------------------------------------------------------------------------------------------
** Please support this idea with your likes and comments, it is the best way to keep it relevant and support me. **
--------------------------------------------------------------------------------------------------------
AXSUSD

AXS/USDT second buy trade setupPreviously we had a buy setup for AXS. Right now it seems that we'll have another downside swing. So sharing an alternative buy signal.

AXS\USDT 👦Adam and Eve👧🇺🇸Hello friends👋.
📈Long: 5-10% of deposit
🔴SL: $16.19
🟢TP: 23.91$
The figure of Adam and Eve has formed, pay attention to how much this instrument was bought back when the price fell below the level, there could be a good growth, long!📈
If you liked the idea, I will be grateful for the likes and comments!

AXS/USDT potential fast rallyIt could be the perfect timeing for the next short-term wave up. If we break above the Fibonacci resistance, the uptrend trend might become very strong.

AXSBTCJust an idea....AXSBTC is very bullish to me...If it keep channel and brake it it will make IHSand to me a huge profit... Just an Idea...

AXSUSDT GOING HIGH !?Just in my opinion, AXS Can go higher to 26.55. If you want to Draw, AXSUSDT already breakout the bullflag Pattern and now on retest mode
Disclaimer : Do Your Own Research First, I'm not a financial Adviser. This is High risk signal, don't entry if you want to blame me when this signal fail.
AXSUSDT | ENTRY : 18.05-16.60 | SL : 15.15 | TP : 26.55

Axie Infinity 4th August 2022Title: AXS 4th August 2022
Time Frame:
1D
Indicators:
STOCH RSI - Hidden Bullish Divergence
Price Action:
The price has rejected off the 0.618 level 2 times, and currently it is sitting just above the EMA50.
Looking like exhaustion from the bears.
I think it is possible the price goes to maximum $19.89
--Like, follow or drop a cheer if you find my findings useful!

Axie Infinity (AXS) - August 3hello?
Welcome, traders.
If you "follow", you can always get new information quickly.
Please also click "Like".
Have a good day.
-------------------------------------
(AXSUSDT 1D Chart)
Primary resistance: 20.89
Secondary resistance: 31.13
Support: 14.39-15.68
The key is to find support and move higher near 17.20.
If it falls below 14.39 and is resisted, a Stop Loss is needed as it could lead to further declines.
------------------------------------------------------------ -------------------------------------------
** All descriptions are for reference only and do not guarantee a profit or loss in investment.
** The MRHAB-T indicator, which is inactive on the chart, contains indicators that indicate support and resistance points.
** Background color of Long/Short-S indicator: RSI oversold and overbought sections
** Background color of CCI-C indicator: When the short-term CCI line is below -100 and above +100, oversold and overbought sections are displayed.
** The OBV indicator was re-created by applying a formula to the DepthHouse Trading indicator, an indicator disclosed by oh92. (Thanks for this.)
(Short-term Stop Loss can be said to be a point where profit and loss can be preserved or additional entry can be made through split trading. It is a short-term investment perspective.)
---------------------------------

AXSUSDT - 1H - Reject PriceA negative divergence is forming in the one-hour time frame, if the confirmation of the divergence is seen in higher time frames, it is suitable for the short position.


Waiting for AXS Breakout to go Long? 🟢AXS Alert!
- Major Resistance because of:
> Downtrend Trendline
> Hourly Resistance
> Pivot
> Rising Wedge
> 4h Wicks Rejection Forming

AXSUSDT 6H TA: Breaking TrendLineAccording to the chart, the line has broken the downward trend and if it can break the resistance of $15.5, it can move up to $19. A buy offer is given at $15.5 if the resistance is broken.
Its not Buy or Sell SIGNAL
DYOR
BY : Mohamad Teriz - @AtonicShark


AXSUSDT 1H: Possible LONGOn the hourly chart, #AXSUSDT has the potential for an uptrend to 15.0$,
SL 13.65$


AXS overbuying, SELL now, take profit!💎#AXS
▪️The RSI indicator is overbought, which signals an imminent correction. The coin has grown well over the past 24 hours, now it's time to go for a correction!
💎In order not to miss a buy signal, subscribe and stay tuned for new ideas. Every day I post 10 profitable ideas per day.

AXS at McDonald's stable salary!💎🔥Subscribe to the channel, get notifications about signals!🔥
#AXS
▪️Now we are holding on with our last strength above the level of $14+, I think they can play tricks and merge in an instant. I also drew the Head and Shoulders pattern.

AXS AnalysisThis is my idea. I have tried my best to bring the best possible outcome to this chart, Do not consider it FINANCIAL ADVICE.
This chart is likely to help you in making better trade decisions.
I am not a market maker I could be wrong.
Everything depends on the BTC movement
Everything is on the chart.
Thank you

AXS/USDT AXS big pump coming . SL : if closed in 4h below 12.42 $ . Target for short term showed on chart .if futures Lev : Max 5x .

AXS - Axie InfinityAXSlooking prime for another drop to $9, after a little dead cat bounce and continuation to the down side. None of my 4 indicators showing any bullish confirmation on the Weekly Time Frame.
- Weekly MACD (Bearish)
- Weekly Pekipek's Divergence BETA (Bearish)
- Weekly RSI (Bearish)
- Weekly Stochastic RSI (Bearish)

Axie Infinity AXS Entry Range, Take Profits and Stop LossAXS/USDT short
Entry Range: $18.70 - 20.20
Price Target 1: $17.90
Price Target 2: $16.50
Price Target 3: $10.50
Stop Loss: $23.50

AXS will continue to fall -40%🔥Subscribe to the channel, get notifications about signals!🔥
#AXS
▪️AXS will continue to fall, the next stop is -40% to the deposit.
💎The market is in a downtrend, there are no prerequisites for growth yet, let's be realistic.
