AXSUSDT
AXSUSDT Elliott Waves AnalysisHello friends.
Please support my work by clicking the LIKE button👍(If you liked). Also i will appreciate for ur activity. Thank you!
Everything on the chart. (update)
Entry: market and lower
Targets: 12 - 15 - 17 and maybe even ~20
after first target reached move ur stop to breakeven
Stop: ~6.7 (depending of ur risk). ALWAYS follow ur RM .
RR: 1 to 7
risk is justified
Good luck everyone!
Follow me on TRADINGView, if you don't want to miss my next analysis or signals.
It's not financial advice.
Dont Forget, always make your own research before to trade my ideas!
Open to any questions and suggestions

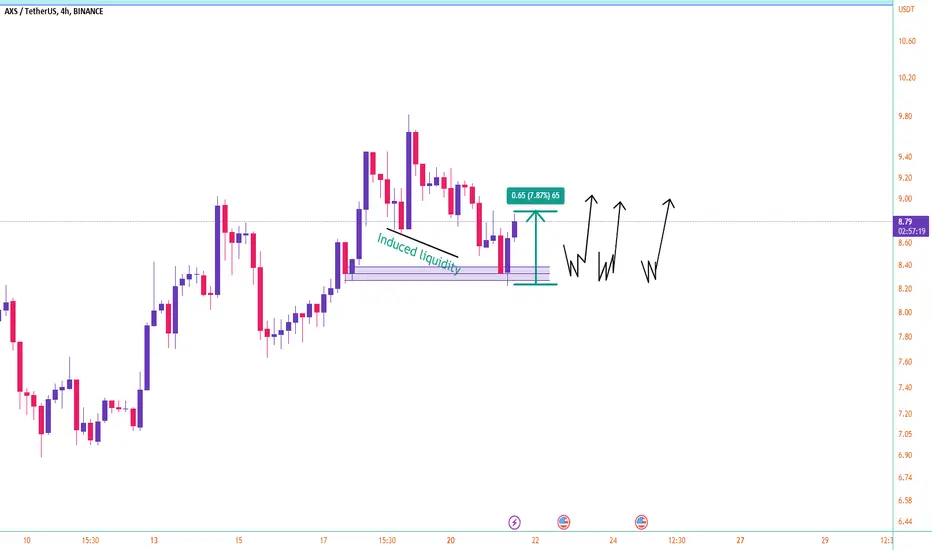
An analysis of the working style of phantom tradingFriends, pay attention, even though it has a strong type of liquidity, i.e. it has induced liquidity and it increases the percentage of the zone, but in my opinion, all three modes of confirmation means choch breaker block.And I drew the market structure shift for you, try to enter with confirmation

Axs Looking Good For MidtermPreparing For Massive Bullish Moves
Forming Descending Channel incase Of Breakout Expecting 300 to 320% Bullish move


AXS/USDT SHortSwin trade chance of retest back again. If BTC drops in the next 48 Hr alts will bleed.
lOW RISK 1:3PROFIT RATIO
don't forget to move sl to BE after 50% suggest risk leverage :5X


AXS BUY SETUPHi, dear traders. how are you ? Today we have a viewpoint to BUY/LONG the AXS symbol.
For risk management, please don't forget stop loss and capital management
When we reach the first target, save some profit and then change the stop to entry
Comment if you have any questions
Thank You

AXSUSDT Elliott Waves AnalysisHello friends.
Please support my work by clicking the LIKE button👍(If you liked). Also i will appreciate for ur activity. Thank you!
Everything on the chart.
Entry: market and lower
Targets: 15 - 20 and maybe 25
after first target reached move ur stop to breakeven
Stop: ~6.1 (depending of ur risk). ALWAYS follow ur RM .
RR: 1 to 5
risk is justified
Good luck everyone!
Follow me on TRADINGView, if you don't want to miss my next analysis or signals.
It's not financial advice.
Dont Forget, always make your own research before to trade my ideas!
Open to any questions and suggestions

Axs Getting Ready For Another Breakout Seems Like Getting Ready For Further Bullish Move
Forming Bulish Pennant In 8 Timeframe
Incase Of Breakout Expecting 45 - 50% Bullish Move
Keep Eyes On Axs For Breakout

AXSUSDT LONG SETUPThis is my setup for going long on AXS over the next few hours. I expect the price to go to the upper trend line again and return to the lower support line, and from there on, I have no idea. If you know something, tell me in the comments .
Content is for informational purposes only and not financial advice

AXS strong resistanceIn the four-hour chart, AXS is under relatively strong selling pressure at 10.245, and the price has large price action here.
-
At present, AXS is in an upward trend. If it does not fall below the trend line and the previous low of 7.610, it has a chance to break through 10.245.
-
After breaking through 10.245, focus on the upper target:
11.825
13.040
14.760
15.840
-

AXS USDTFinally, the uptrend line of AXS was broken and it is currently in a falling channel. It is below the 200 EMA in the 4-hour time frame. If we believe in the downward trend of the market, the scenario in front of us will be the most likely scenario.

AXS's price reacted to the resistance rangeAXS's price reacted to the resistance range of $11.78 to $12.50 after successive collisions.
The resistance for which it is intended is the range, the breaking of which could change the trend in the daily time frame from range to bullish.
But the solid negative reaction observed to this level has caused the movement to range between this resistance and support from $8.40 to $9.40. Also, the 50% retracement Fibonacci retracement was just within the designated support area, reinforcing this level.
So as long as this range is maintained, there is potential for further growth and breaking the resistance ahead. Also, in case of breaking and continuing the upward trend, higher targets range from 18.5 to 20 dollars.

AXS/USDT | Pretty Solid Descending Channel Consolidation..!!
#AXS Looks Promising here 🔥
Pretty Solid Consolidation in Descending Channel, Seems like Bottomed out & Ready to Fly.
In Case of Breakout, Expecting +400% Bullish Rally in the Midterm..🏄♂️
It's important to maintain a Disciplined and Patient approach to investing in order to achieve Long term Success.
Please like the idea for Support & Subscribe for More ideas like this and share your ideas and charts in Comments Section..!!
Thanks for Your Love & Support..!!

Possible $AXS BounceWe have a possible bounce action here as $AXS retests its previous resistance now turned support. It also coincides with S/R flip on the RSI trendline.

AXSUSDT LONG SIGNALSHi, friends. Nice to meet you.
You're all having fun trading, aren't
AXS is currently located in the sales section and believes it will rise soon.

SELLING AXS/USDTi will take a short/sell position on AXS/USDT
50% of position at 11.50
TAKE PROFIT 11.3
STOP LOSS at 11.81
50% of position at 11.70
STOP LOSS at 11.81
TAKE PROFIT 11.3
FOLLOW FOR MORE

AXSUSDTI see a Bull Flag breakout forming in the Daily chart of AXSUSDT.
Bull flags are usually a continuation pattern but I'm waiting on next daily candle close above the resistance to confirm the bullish breakout.
The volume is increasing with it so it's possible to continue the bull trend it started.
Both my take profits are shown which are major resistance zones.

AXS LONG SETUPHi, dear traders. how are you ? Today we have a viewpoint to BUY/LONG the AXS symbol.
For risk management, please don't forget stop loss and capital management
When we reach the first target, save some profit and then change the stop to entry
Comment if you have any questions
Thank You

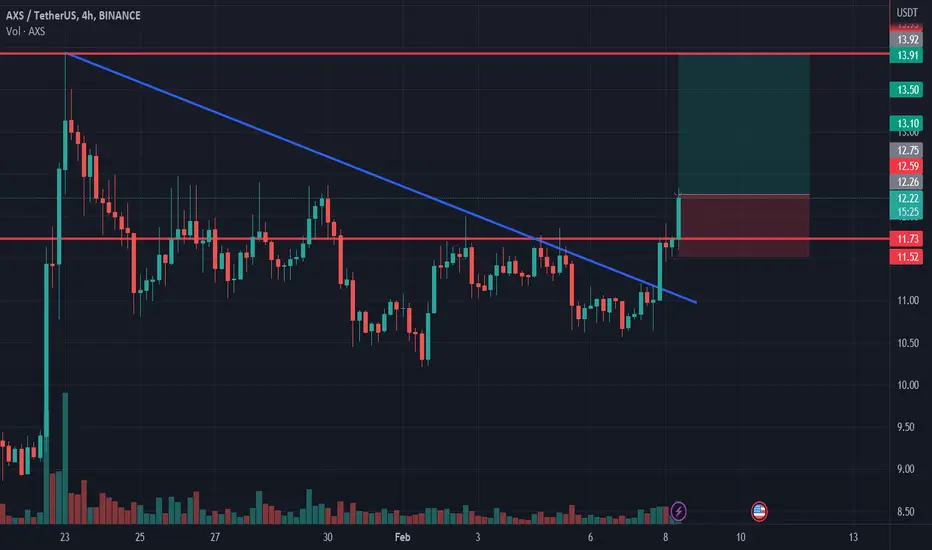
AXS longAXS broke trough the descending trendline. Asset broke trough the resistance level. Bullish movement to resistance level at 13.9 is expected to happen.

AXSUSDT…strong support#AXSUSDT
Looking at the chart, you can see that AXS has formed a strong support at the Fib61% retr.
It is a very good resistance, but need one more thing to confirm that it’s going up to 14$, what is it?
