BA Daily outlookBA hit my TP of $218 perfectly. My long term PT is $253 Go short if we break $200. I believe we will break $218 next week and slowly make our way up to $253
BA-2

Boeing BA Buy Setup - How to TradeTo the bulls, Boeing looks like it may have bottomed with an ascending triangle formation. To the bears, it looks like Boeing reached the top of a bear flag. There is no way on knowing who is right, but this is how to trade it.
Bear flags are essentially ascending triangle breakouts that fail. When an ascending triangle breakout fails, bulls become disheartened and are likely to bail on their long as soon as the supporting trend line breaks (pink).
Bears sold today when the price hit the red line, which would be the upper part of a potential bear flag. You might be asking yourself, how could they sell on the red trend line when it didn't exist until today? Some say you cannot draw a trend line off only 1 point, and they are wrong. So where did this trend line come from?
Simple, copy the pink trend line and paste it directly on the local high. You will see that this forms a perfect bear flag and a great place to take profit / sell. A lot of experienced traders use this method to create trend lines from only 1 point and I know first hand that it's a very profitable strategy for finding amazing areas to take profit and short.
Did you miss out on the Boeing move today? No worries, here are three areas to enter a long.
1. You can wait for the price to come back down to test the ascending triangle breakout (blue support line, red star).
2. You can also buy on the pink trend line (green star) if price happens to drop that low.
3. There is 1 more trick to ascending triangles that many people do not know about (see my example above). Sometimes they are not perfect patterns, but the stay intact even if the pink line breaks. If price fails to make a new low, you can buy at the pink star in hopes for a double bottom. Ascending triangles signal that people are buying the dip, and if price bottoms at the previous low, this means they are still buying the dip.
Personally, ascending triangles are my favorite patterns to trade because the buy points are flat or ascending, making it easy to set a reasonable stop loss. It is also the most common pattern I see on strong trending stocks, on all time frames. You'll see them on the monthly chart as well as the 30 second chart. They simply signal that people are buying the dip and becoming more impatient with each drop, that is why the dip becomes less and less until it eventually breaks out the top from all of the buying pressure thanks to impatient buyers.
Hope you enjoyed this analysis and tutorial. Please like and subscribe and I'll add more!


Wowwwwzers 45%! (BA)Boeing said oh no no no! Mr. Resistance held no chance as it got slaughtered for a massive move up today for an additional 11.47% in gains!!! ✌🤑💲💰
We are still sitting from $141.77 as our custom trading system continues to show life firing green!
Will keep you updated for more updates.
Smash that like button if you like getting them big gains!!! 💰💰💰
Have a blessed day!
🥇MLT | FULLTIME PRO TRADERS

AAL ShortWe have a descending flag forming here on AAL. I expect to see it break down and have sharp reversal downwards.

MGY triple top or ascending triangle?Two scenarios can play out here, more than likely (bullish scenario) plays out
1. (green line) we blast through 6.48 and we reach $7-8+
2. (red line) we test 6.48 and reject... test 5.47 or 4.65 then BOUNCE BOUNCE!

BA - Break out : continuation to 195 range?Continuation rally? to 100ema resistance : 195 next target

Start of direction change LONGBoeing has started changing direction to the upside. I will be going LONG and adding to my position over time.

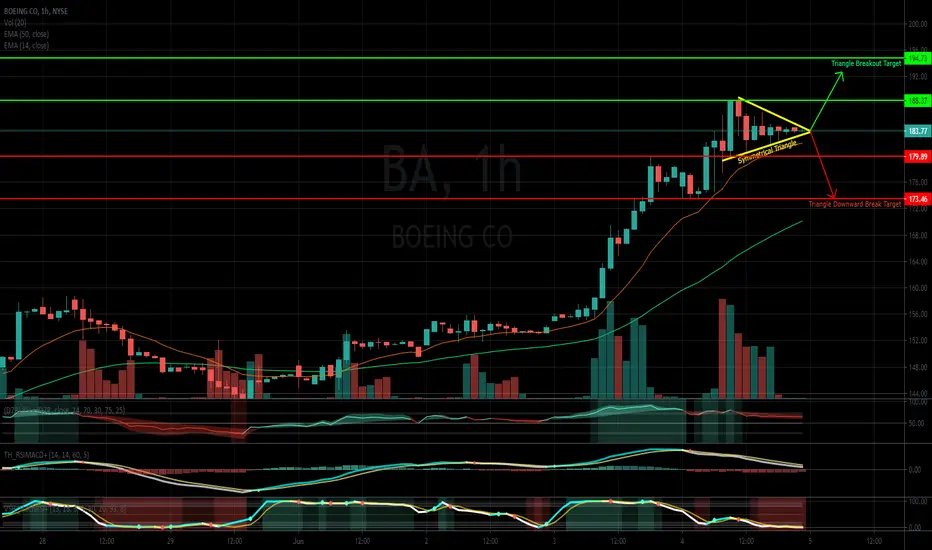
BA Analysis Symmetrical Triangle + Loss of Momentum + Trend Bullish (Time Frame Confluence)
Wait for a break of the triangle before entering Long/Short, Watch out for Fake-outs in a downward break
30% / 11 Day Hold Update (BA)What an AWESOME day as we put in some solid GAINS today on boeing! 💲💲💲
Yesterday we showed you how we were all shooting green with the Crossover strategy and the ema dots on these larger timeframes after the massive selloff. Today we we're able to get up to 30% gains in the last 11 days for a nice swing trade, we continue to hold... what is next to come. ⬇️⬇️⬇️⬇️

BOEING ($BA) | Is Everything With Wings Taking Off? ✈️👨🏽✈️ Boeing and airline stocks have performed very well recently, in-fact many of the stocks beaten down by COVID are on the move. Of all of these stocks, Boeing has one of the best looking charts around. Add to that that production is ramping up along with demand, and we have a great justification for a long position along with the newly formed bullish uptrend.
Resources: www.thestreet.com + q13fox.com
✨Drop a comment asking for an update, we do NEW setups every day! ✨
Like, Comment & Follow to help the community grow 🎉🎉
---
1. Fractal Trend is showing a freshly formed uptrend (Aqua colored bars) on the 1-hour timeframe.
2. With this strategy, we are looking for long setups in an uptrend and as such want to enter long on retests of bullish order blocks plotted by Orderblock Mapping (Aqua colored lines) and/or bullish S/R levels plotted by Directional Bias (Aqua colored lines).
3. The play here is to buy a potential pullback to the S2 orderblock and S/R flip, as we suspect it will act as support due to the significant recent reactions to this range.
4. Our stop is placed below S2 and our target is a retest of the current R1 orderblock where we expect to find resistance. This gives us a solid 5.31 R:R.
Although Boeing may just keep going, we don't think it is heading for more downside unless the broader market sees a significant change. Given that, the logical play for us is to buy support. Of all potential supports which retain the bullish structure, S2 is the most logical, and given that the rest of the setup falls into place.
Good luck frequent flyers!

Buy Last Kiss BoeingBuy last kiss near 157.3 (retest of accumulation resistance/support)
Buy stop above that candles high.
SL mid range accumulation.
TP open

AAL LongAmerican has been lagging behind airlines and should see a nice move upwards once it breaks above this neckline.

Up 21% Boeing (BA)I believe I alerted you all of the trend shift from my custom trading system on may 24th and said clearly I'm adding long at 141.77! 💰💰💰💰 that's a 21% return as all indicators from the Crossover strategy and the ema dots continue to shoot green! 🤑🤑🤑
Just the other day boeing announced they were laying off a lot of the workforce and people got scared trying to trade the news! Don't trade the news! Trade the charts! 💯
Best of luck to you all! Have a blessed trading week!
🥇MLT | PRO FULLTIME TRADERS

LONG $GOL, longtermBrazilian airline stock $GOL has a perfect set up, bought it last night, and its up 20% already!
Breakout on the ascending triangle could bring in a real big push! Longterm hold for me, will bounce back nicely!
Price Target: $10-$20


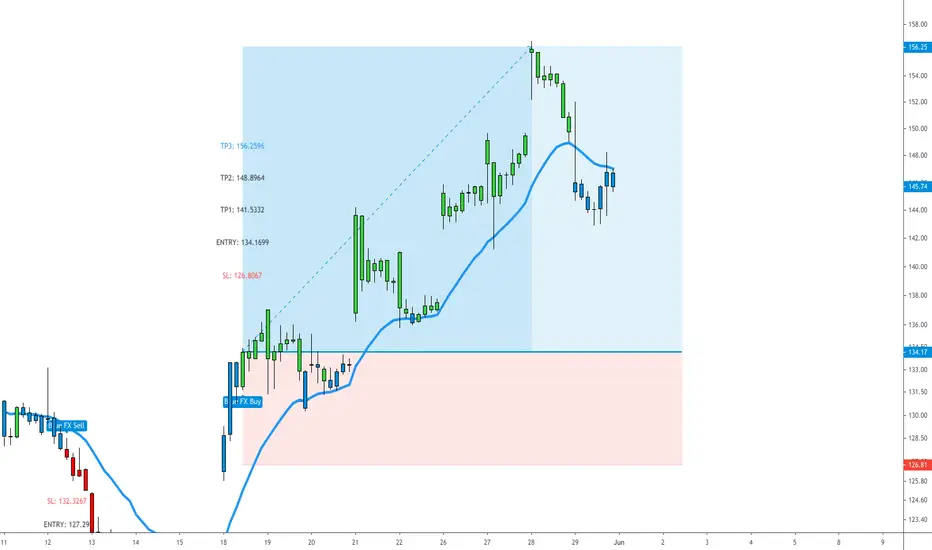
BA All targets hit - trade with stocks too!Moving forward we will be sharing more stocks and Crypto trades using our strategy - as you can see they work too.
Some of our traders have used this to capitalise from moves in major stock prices.
For more information on our strategy please view our 'Scripts' page on our Trading view profile.
Our V2 strategy shows the SL and multiple TPs on the chart too - these are customisable based on the ATR of each pair.
We have set these so that TP1 is 1:1 TP2 is 1:2 TP3 is 1:3 RR.
There are infinite ways to manage your trades to suit your mindset and time.
Works on all instruments
Directly onto your own personal trading view - all devices work
Non repainting
Please follow us to keep up to speed with our trading ideas, live streams (coming soon) and weekly recaps using our strategy.
We are continually marking some tweaks and marginal gain improvements to continue to make this easier for our trades and even more profitable. All updates are given to our members and previous purchasers FOC .
Regards
Darren
Blue FX
BOEING BREAKING THE CHANNEL !BA is bullish
It broke up the descending channel with good volume
We can expect a +17.5% from here

+$1510 today on 2 wins Hi Guys,
+$1510 today on 1 large win in $BA and 1 small win in $ROKU!
Volume low in the market so I'm out!
Enjoy,
Enda

BA Analysis Updated (5/24 154 Target Hit)Simple ABC Correction + Momentum + Bullish Continuation
Boeing is looking to continue its bullish momentum inside the new channel it has created after breaking out of the Descending Triangle. Price Action is telling me we should see a small pullback to the area circled with bullish continuation to the next target at 164.80.

LONG CCLKeep your trading simple 🚀🚀🚀
Long term bullish - this trade can take some time to unfold.
T1 = minimum risk reward 1:1
Mind term target $24.6 - Closing gap.
Entry was on the crossover.
I would use a smaller position size because of the huge S1 S2 (stopping points).
I always leave 1/3 of my position for long term gains - moving my stop to my entry if I need to give room for the volatility or using trailing stop for maximum gains.
For maximizing your profits you can use Options.
Not a financial advise just my view - trade smart trade safe.
Follow me to support my work, Thanks!

BA Boeing bullish crossoverMost big cap tech companies already reclaimed their previous highs, Industrials straggling and it could be the time for BA to get back to 300s, if possible to 450s previous highs, bullish crossovers.
