BA


AMZN These are the things I look for when drawing my levels. I don't use any indicators because I believe they can be misleading and cause an inadvertent bias. I look at a trade from multiple angles. Its not as simple as entering into a trade just because a stock broke a level. You have to align your trade with News events, Upgrades, Strength of sector, Strength of market etc..
1. Analyze price action
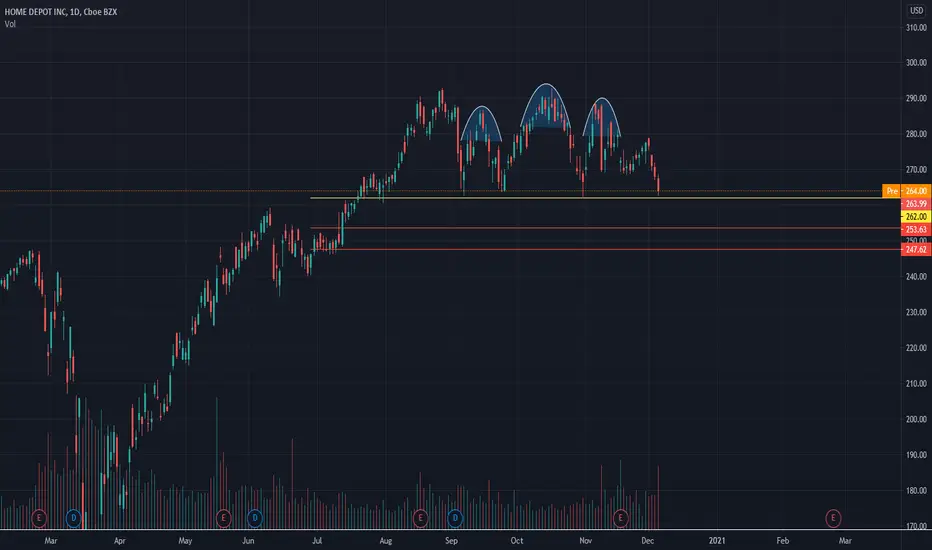
I look at how many times a stock fails at a certain resistance area.
i.. If AMZN fails at 3250 multiple times, that means that's a strong level. and when it finally does break, a big move can happen.
2. Stock Patterns
a) Pennant, Bull Flag/Bear Flag, H&S/Inverse H&S, Wedge, ascending/descending triangle
2. Correlation with SPX/SPY
a) Is AMZN moving up while SPX is moving down? This indicates that AMZN price action is strong. Is AMZN moving down with SPX moving up? This indicates that AMZN price action is weak.
b) You also have to look at what the stocks in the sector you are trading are doing. Say AMZN does break 3250 but the tech sector is weak that day, and SPX is weak, this can drag AMZN down.
3. News.
I check pre-market for news every morning. Did the stock get an upgrade/downgrade? Is there any news being anticipated?
If you are are patient and wait for breakouts at key levels, these types of trades can present a great risk/reward ratio. You don't need to trade everyday. You can make 25-30 trades a year and make $100k+ relatively easily while only risking a small amount of money. Don't be in a rush to trade everyday. Preserving capital and just waiting for the best setup is 80% of trading.


$BA - Bull Target $236 - $265 & Bear Target $200 (Buy Area)Break out from triangle
Target $236 - $265
Break down from triangle
Target $200 - BUY AREA


$BA BullishI am bullish on BA, see reasons on chart. I can see $251 tomorrow to close the gap from March 5, 2020. @theeconomicalm1

Boeing [BA] Back To Pre-Crisis HighsBoeing is doing great this month. The US elections and vaccine news made investors realize that Boeing was criminally undervalued.
Today is the day when Boeing finally beats the summer high around $230. With a vaccine within grasp, I see Boeing reaching its old highs again.
Consider Resistance 1 and Resistance 2 as great areas for taking some profits. In case you're more bullish minded than that, ride the wave till $400!


BA, getting closeBA, for any bottom feeder looking for a name that may recover. Price is getting tight, and if these vaccines start to work..

BA Ascending TriangleLooks ripe for a break out on good news and optimism; PTs: 219.5, 222 EOW 233 EOM

$BA - 50ma has crossed 200maBack to $BA - This will likely be a buy signal for many. Bull pennant forming as well. I can't buy in as my money is tied up in other stocks, but may move some things around to get into this.


BOEING (BA) | Short-term pessimist, long-term optimist BOEING ( NYSE:BA )
+ Possible bullish bat and gartley pattern - Looking for Point-D
+ Bullish flag pattern
+ Symmetrical triangle
- Boeing 737 Max scandal, Covid19, China sanctions, Earnings report
+ Short-term pessimist, long-term optimist. Aviation industry will definitely recover after covid19
+ Stop loss is your friend
+ Take profit depends on your risk appetite

BOEING (BA), Where now?About Boeing: The Boeing Company is the world's largest aerospace company and leading manufacturer of commercial jetliners and defense, space and security systems. A top U.S. exporter, the company supports airlines and U.S. and allied government customers.
BA is very interesting, here is my technical analysis:
------------------------------------------
Two possible expected outcomes:
------------------------------------------
If BA BREAKS DOWN 196, it can reach the range of 180-188.
It's a great place to collect BA.
If BA DOESN'T BREAK DOWN 196, it can continue to climb and you can also enter BA.
------------------------------
Or if we are Wrong:
------------------------------
if BA BREAKS DOWN 180, it will return to it's 160 levels.
Remember BA is affected by Corona news has BA declined a lot because of the Corona as Corona effect the whole Aerospace industry.
In general BA is LONG for the long run.
Long run first target is 300.

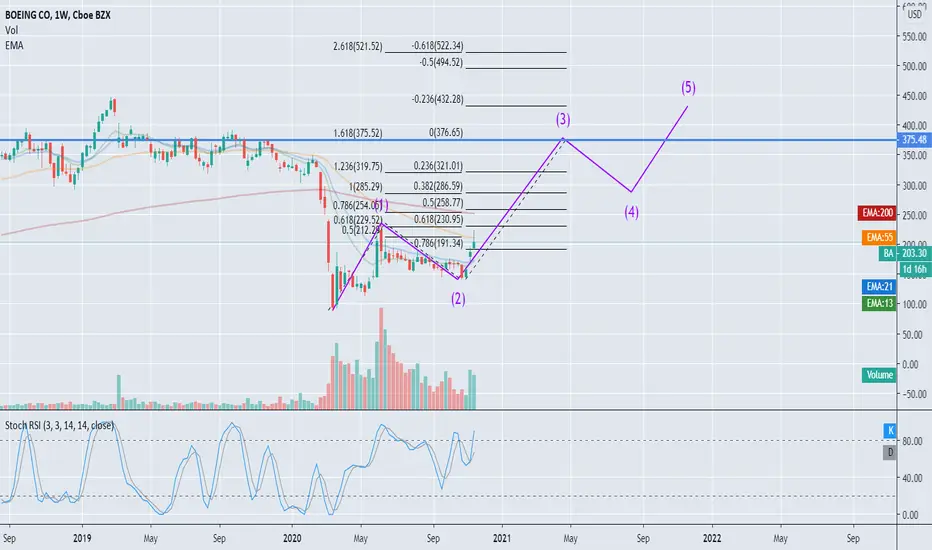
Possible BA wave 3 formingIf you're bullish on airline/recovery stocks...this might be a good long term play.
Not entirely sure, but this could be one of the bullish scenarios.
Not financial advice
BA intraday scalp shortIf BA can't get over 218 intraday +- a point it's a short to 214 an potentially LOD


$BA - Watchlist - Wait For 50MA$BA has looked good of late. Closing above 200MA. If you're looking for confirmation you could wait until the 50MA cross up above the 200MA as a buy signal. It will likely be a buy signal for a lot of people. But I wouldn't fault anyone for jumping in now. Definitely seeing some accumulation volume as well.
