Not Yet Oversold But Stock Market Makes An Important LowAT40 = 23.4% of stocks are trading above their respective 40-day moving averages (DMAs)
AT200 = 24.7% of stocks are trading above their respective 200DMAs (new 32-month low)
VIX = 22.5
Short-term Trading Call: neutral
Commentary
The technical damage continues in the stock market. Amid all the carnage and massive gap downs, I am surprised AT40 (T2108), the percentage of stocks trading above their respective 40-day moving averages (DMAs) is still above the threshold for oversold trading conditions (20%). My favorite technical indicator closed at 23.4%. In the last oversold period, T2108 closed as low as 9.7%.
{AT40 (T2108) lost 6 percentage points and closed just above oversold territory.}
While the stock market is not technically oversold, AT200 (T2107), the percentage of stocks trading above their respective 200DMAs, closed below its lows from October. AT200 hit a new 32-month low and a new extreme (note that AT200 dropped to the single digits during the early 2016 sell-off). This important low means that money managers are once again looking at broad damage in their portfolios. A large share of those stocks are trading in bearish territory and look like sells into the next rally. AT200’s return to these levels confirms the lasting technical damage slamming the stock market.
{AT200 (T2107) sliced right through the closing lows of October as technical damage spreads again in the stock market.}
The charts of the major indices say plenty. The S&P 500 (SPY) lost 1.8% and closed exactly at the October low and the low of the last oversold cycle. The index is down 1.2% year-to-date. The NASDAQ lost 1.7% to close at a 7-month low and is now flat year-to-date. The Invesco QQQ Trust (QQQ) lost 1.8% to close at its own 7-month low. QQQ is still UP 2.2% year-to-date.
{The S&P 500 (SPY) lost 1.8% on the worst gap down of the past 6 weeks of weakness. An attempted gap fill was beaten back down by sellers.}
{The NASDAQ lost 1.7% on a gap down that established a worse level of weakness for the tech-laden index.}
{The Invesco QQQ Trust (QQQ) lost 1.8% on a bearish gap down and a successful fade of an attempted gap fill.}
The volatility index, the VIX gained 11.8% to close at 22.5. The VIX surprisingly is not already back to its highs from the previous oversold periods. If someone told me about the large gap downs the market experienced on the day, I would have assumed the VIX was soaring right past the previous highs.
{The volatility index, the VIX, is on the rise again and is right back to elevated levels (above 20).}
The Australian dollar (FXA) versus the Japanese yen (FXY) is, surprisingly, nowhere near its recent low. Combined with AT40 versus AT200 and the VIX, this positioning tempts me to think that the stock market is near a low for this latest selling cycle. Note that part of the lift is coming from recent bullish economic news.
{AUD/JPY is clinging to its 200DMA and is still well off its recent lows.}
The stock market is in desperate need of positive catalysts to break out of this cycle of selling. While the relative gulf between AT200 on one side and AT40 and the VIX on the other side looks like a potential kind of bullish divergence, I am keeping the short-term trading call at neutral. I downgraded all the way from bullish to neutral because of the 200DMA breakdown for the S&P 500. Today’s selling just confirmed that trading call. I am assuming the healing process for this technical damage needs to happen in oversold territory. By trading rule, I will flip back to bullish if AT40 drops below 20%.
BA

Keeping an eye on BA LONG Once 370 level gets broken I expect to see a steady climb to 390 levels. Keeping a close eye on this one.

$BA 372 Resistance Idea IF BA Breaks over 372 and holds I think it can see 380-385 rather quickly , but if breaks below 365 and gets pressure due to the whole plane crash issues and fades stock can see 354-355 range.
I'm betting to the downside right now with NOV 16 362.50 puts at 4.80 , stop loss around $3/3.50 or if stock gets over 372 and holds.
This is not financial advice , just giving my opinion and what trade im making.


Watch | Baerish Divergency | Boeing NYSE:BA
Boeing could form a bearish divergency should MACDs tick down on the Daily, or at least don't spike as much as on the former high and then tick down.
Good candidate to watch.

BA.. on point. and there we go - Right at the support line. Expect more selling tomorrow and next week.


$XLF bullish credit spreadNew bullish credit spread on XLF (financials) for OCT 12! Not this Friday. Solid movement this morning in the market and financials is starting to show strength. Decided to take this move out two weeks to allow for the bottom to confirm and some bullish movement to occur.
Entry 27.79
Max profit 28.50
Break even 28.14
0.38:1 risk/reward

BA bearish butterfly and daily shooting star combinationFirst of all, I don't really want to short this name.
But this trade is too good to ignore, a harmonic pattern and daily shooting star combination!
I won't take the trade as I don't have other conviction to short Boeing at all,
but I would very like to record this trade down and see how it goes yo!
Still, this is a better sign for the bulls to take some profit rather than for the bears to create short positions.
Let's see how it goes!

Drones and Virtual Reality - A Spec PlayShares of ARTX look interesting as a speculative play for longer-term investors. The company is in the fields of drones and virtual reality, with recent contract wins with the US military.
At 3 dollars and change, it's a cheap way to play on the long-term growth in those areas, which are bound to see strong growth for some time.
Immediate support lies at $3.35, with additional support below at $3.10 and then $2.70. Upside targets are $3.75 and then the highs at $4.35, or +10% and +28%, respectively from today's close.
I jumped in via calls, specifically the February 2019 $2.50's (currently I.T.M.), paying $1.15 for them. Breakeven comes at $3.65, or 7.4% higher from here... and being so far out, there's plenty of time for this to work.
It may grow in to an investment after I can dig in deeper to fundamentals. I'll update this as more info is known to me. For now, consider it for a spec play or at least keep it on the radar!
Happy trading!

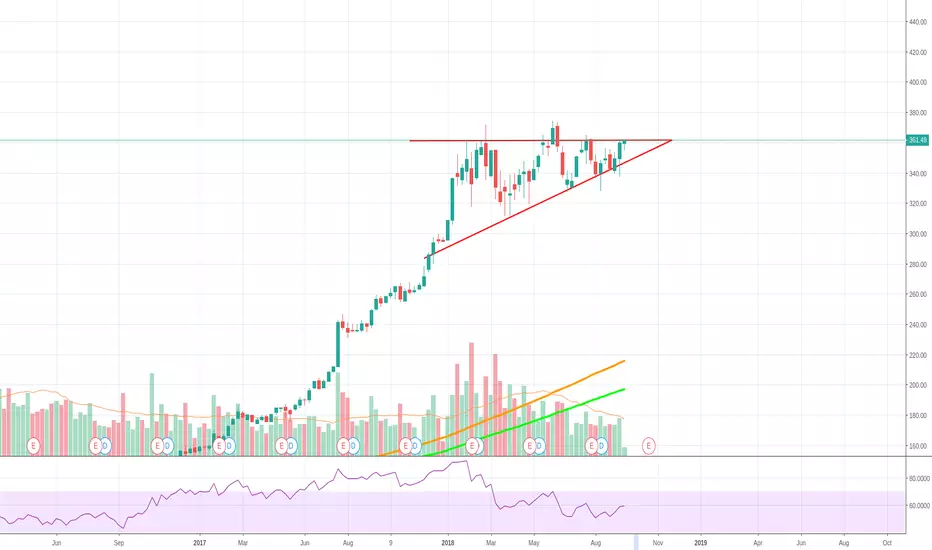
BOEING COMPANY (THE) - Long - Ascending TriangleWe are looking BA and we have this ascending triangle in the weekly chart. We'll be monitoring it but its a long term/swing position as weekly movements take a bit of time to develop.
Conservative play: wait for close above 364.73 and long with short below the formation
Entries: 365.17
Target 1: (trailing stop-loss 25 usd / choose your own targets for taking profits)
Stop-loss: 348.98
Disclaimer
CryptoCue is not providing individually tailored investment advice and is not taking subscribers personal circumstances into consideration when discussing investments. Investment involves a high degree of risk and should be considered only by persons who can afford to sustain a loss of their entire position. Investors should consult their registered financial adviser before investing.
CryptoCue is not registered to provide investment advice and is simply providing an opinion, giving a particular experience. Information contained here is not an offer or solicitation to buy, hold, or sell any security.
CryptoCue is not a broker-dealer or financial adviser and is not affiliated with an investment advisory firm and does not engage in activities that would require such registration.
CryptoCue and/or any others affiliated with CryptoCue, are not responsible for any gains or losses that result from the opinions expressed herein.
CryptoCue makes no representation as to the completeness, accuracy, or timeliness of the material provided and all materials are subject to change without notice. Opinions discussed herein have not been reviewed by the securities and exchange commission or any state securities regulatory authority.
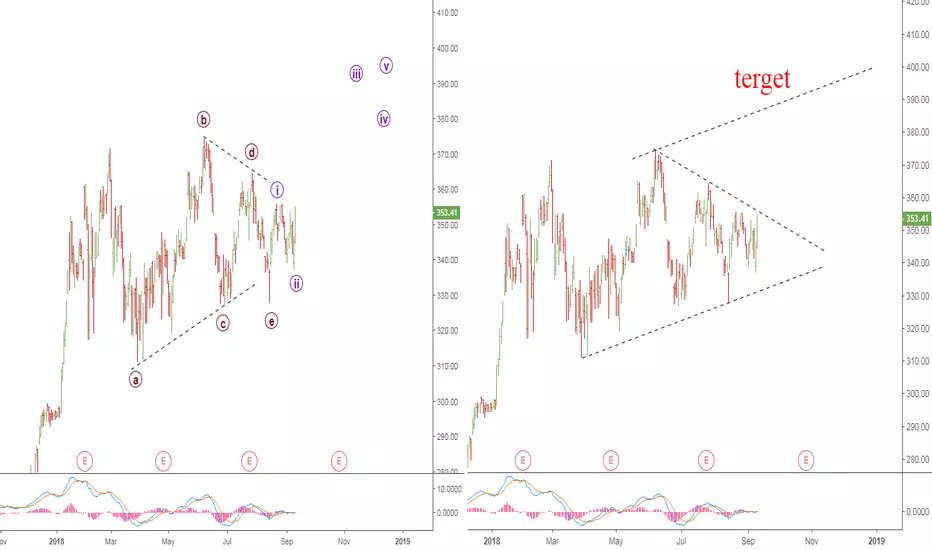
Both of triangles confirm advance (BA)Triangle in left chart is elliotic and in right chart is classic. Both of them indicate to rising trend. trade conservatively with your own plan.
Selling Boeing shares. On the daily chart of Boeing shares, I expect the price to drop in the C wave of the ABC corrective zigzag. Thus, I placed a pending sell order at the latest down fractal. Stop loss at the previous up fractal.

$BA Boeing - Long Term Pennant$BA Boeing - Nearing the resolution of a long term pennant pattern which began earlier this year. I'm expecting an eventual breakout to the upside. Targeting a return to the area of previous all-time high in the mid-370s by November.

A Still Shaky But Now Stretched Stock MarketTechnical indicators keep flagging the stock market's underlying weaknesses. Still, the latest shallow selling is a bit over-stretched.
"A Still Shaky But Now Stretched Stock Market" drduru.com $SPY $QQQ #VIX #AT40 #T2108 $BA $BIDU $CAT $GLD $SLV $DXY $USDTRY #forex $M $NFLX $RIO $BHP $USO $WHR

Selling Boeing sharesOn the daily chart of BA shares, there was a change of trend into a bearish one according to Bill Williams` trading strategy with a recently formed sell fractal. In addition, with high probability, the price is at the beginning of the C wave of a bullish Elliott wave cycle.

Boeing Buying OpportunityBuying boeing after this reversal pinbar pattern appeared on the daily chart. Expecting prices to continue higher.
Cheers :)

#BA sitting right at the resistance line, now support (for now).So the day ended with #BA sitting very close to what used to be the resistance line (it's now working as support for now). If a sell-off starts tomorrow (which most likely will happen due to option expiry and being a Friday as well other noise), #BA can see itself go down back to 351, which may complete Elliott-Wave #4, before heading back up.
Still LONG on it, but cautious as ER approaches and as it appears to exhaust all of its catalysts this week.

Target Hit for today. #BA working and trying to get past that resistance area. Blow past that, and it can hit up to the next one easily (~363). Otherwise, failure back.


Short BA for a target of 340Short BA for a tgt of 340 with a stoploss of 360. It was showing weakness on a 15 min chart and has a limited upside in the short term
