The Stock Market Swings From Bullish Signs to Stop Signs.A snipper from my latest post.... drduru.com
The stock market faded from bullish undertones and back into the resting position. Now we can just look back at what could have been.
For the first time in a long time, I feel compelled to change my short-term trading call from neutral. While the S&P 500 (SPY) still sits well within a trading range of churn, I see several signals which give me bearish vibes starting with my favorite technical indicator: AT40 (T2108), the percentage of stocks trading above their respective 40-day moving averages (DMAs).
Through Wednesday, April 18th, AT40 rallied relatively consistently with 9 up days out of 12 trading days. The last two up days featured weakening momentum and the top, an intraday high of 67.6%, came just short of the overbought threshold of 70%. I typically interpret a rejection at the overbought threshold as a bearish event. I am particularly keen to follow this interpretation given a similar rejection preceded the big February sell-off, and I was very slow to react to that rejection. AT40 swiftly fell all the way back to 55.2% to close the week. I am now eager to see AT40 hold a higher low.
The S&P 500 (SPY) provided one component of a bearish confirmation. At its last high, the index closed just about even with its close after the Fed’s last decision on monetary policy. Not only did the index fail to maintain momentum from there, but also the subsequent selling pushed the S&P 500 right back below its 50DMA. The NASDAQ and the PowerShares QQQ ETF (QQQ) both pulled up short of their post-Fed closes before dipping below their 50DMAs to the end the week.
The volatility index, the VIX, might as well have sealed the deal. Last week, the VIX traded right down to the 15.35 pivot and convincingly held that level as support over the next 3 trading days. While the VIX did not pop as much as I would have expected, I am still respecting this hold of support. I am staying patient before shorting the iPath® S&P 500 VIX Short-Term Futures™ ETN (VXX) again, and I am holding onto call options on the ProShares Ultra VIX Short-Term Futures ETF (UVXY).
The Australian dollar (FXA) versus the Japanese yen (FXY) provided one more piece to the puzzle by breaking down below its 50DMA again. Just a week ago, AUD/JPY looked like it was leading financial markets higher. Now it looks set to grease the skids pointing downward....
BA

BA Daily Long SetupBA Daily
Inverse Head and Shoulders pattern on daily. Break of 340 should run this up to 360s. Notes on chart.

BAH looking to breakoutShares of BAH look set to breakout and finally push thru the $40 level. It's currently in a rising wedge, and given geo-risk and defense sector strength, I like this name. I think $45 will come quick (161.8% extension) if shares breakout. Earnings aren't until May 21st, so I don't see much downside catalyst in the near term.
I want to give it time to work and limit risk, so I just bought June $45 calls for 20c.

BA ShortShort below 319. If gaps down, wait for retest on a moving average or 319 level. Target based on height of the inverted cup is ~270 (also 200 day MA is around that level). But 300 is good support below.
Initial target is 300, if that doesnt hold, 270 next.

BA Long - can we get a nice bounce off resistance line?BA found resistance at $325 price range, as well as the bottom of the Bollinger Bands. Looking for a similar rise as previous bounce.
Major price drop due to tariffs talk.
Future cash flow value shows BA at $425 share price, making this stock undervalued at $338.
Expected annual growth in earnings is 9.8% (generally 20% is considered high growth)
If I could afford long call options for a few months out, I would def. be interested with further research!!


Indicee Overview with the IchimokuI quickly look at the risk potential going into tomorrow markets. I am 98% Cash with a small position in CVX calls. I am also not trading tomorrow. I see lots of potential downside risk.

BA might of broke the down trendBA very bullish stock might have upside potential. XLI bounced of trend support today to boot. Might be good dip buying in the Industrials here.

Boeing BiG SHort ? Why not..I guess time for the short. :)
this Boeing buble can came to end of history maybe..
2016 nearly 1.5 year ago this stock was 100 $. Now 350 $
Bubble :)
Buubbbble Hunter from Turkey :)


Good day for Boeing to fly?Despite the fact that Boeing reach the peak of growth never late find the new one to jump to. Let's have a look at more info and work it out.

BoeingStrong momentum. 2% dividend. Earnings within estimates for Q3. Beat estimates (pleasant surprise for Q2)
The Current stock price is above both the 150 day and 200 day moving average.
The 200 day moving avg line is trending up (for at least one month) since September of 2016
The Current stock price is trading above the 50 day moving average.
The current stock price is at least 30 percent above its 52 week low. ( 85% above it's 52 week low)
The current price is 100% of it's new high.

BA LONG Bull flag for a very strong stock that has been consolidating and now no where to go but up. Buy long or calls.

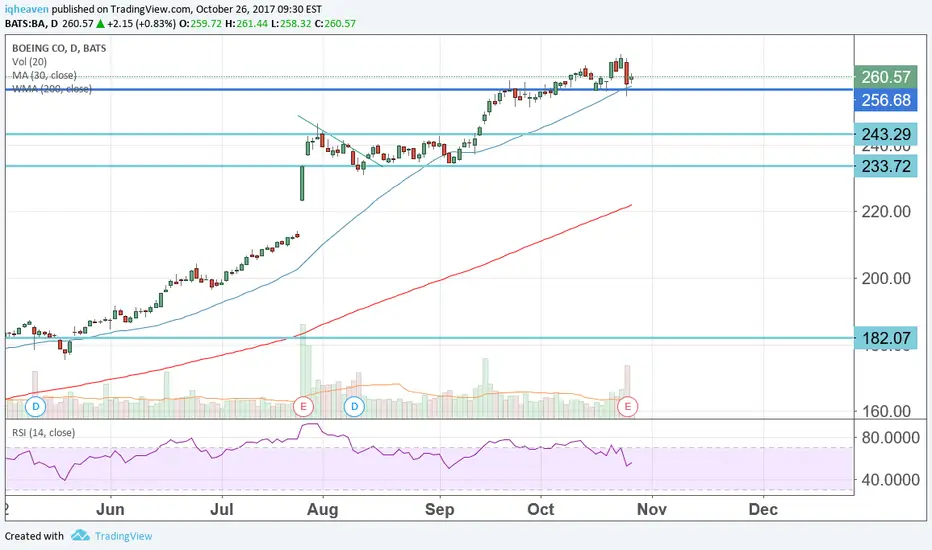
BA inside day long opportunity.Yes, you guess it right, to long in such a high price looks silly again, but it's really one of the most effective way to join an great uptrend without any significant pull back.
As BA's business keeps on growing, many investment bank start to upgrade it with target price higher than 300.00.
I know clearly how unreliable the target prices can be, but to be bullish and try to participate in a trend is always my trading philosophy.
This is one of the case that I don't really want to use the inside day low as my out,
since 1. 8 ema hasn't caught up the inside day low ; 2. I don't really want to risk only 1% in a trade, should give it a little more room to run.
Therefore, the previous pivot @ 254.07 is good enough for me.
Let's see how it goes!

Possible Boeing Trade Possible trade based of North Korea mess. Boeing could see more upside. Will consider weeklies and monthlies.
Feel free to comment if you have any input on this analysis.
Follow for more trades including stocks, options, and cryptos!
Thnx.

BA - Boeing Companies swing trade ideaBA has been consolidating nicely for 1 month now after its earnings gap. Has a nice tight flag forming. If this can breakout of range a swing can be taken with a stop at 235ish. Slower stock with higher float so its more of an IRA type of play for me.

#Boeing - Release of new 737MAX 9 gives positive climb rateHi guys! Not a technical analysis, more of airplane lovers analysis. I'm forecasting Boeing price climb upto 192 as there are more and more interest in their new 737 family aircrafts. They did a lot in terms of fuel efficiency and introduced longer fuselage. New CFM engines, new signlets look amazing and they decrease fuel consumption by manipulating aerodynamics.

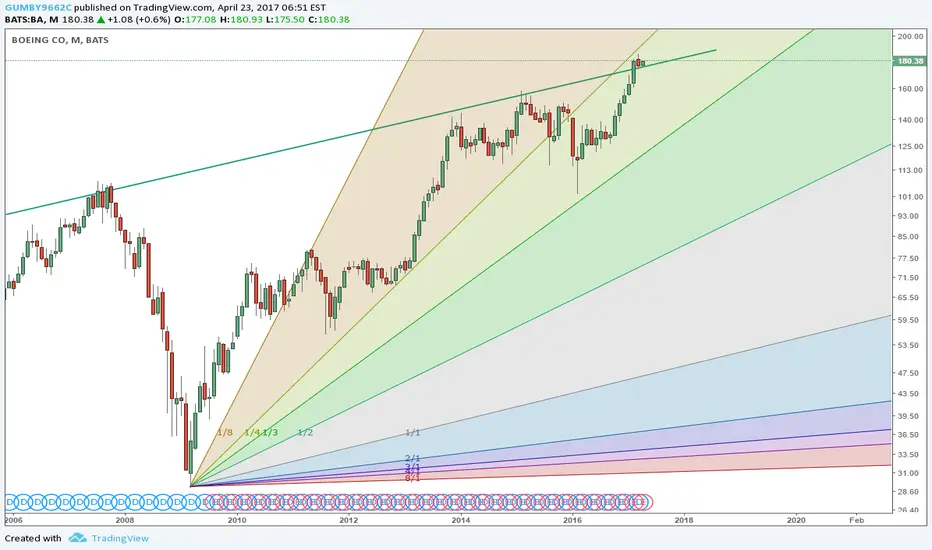
BA priced to perfection hereI know news is quite positive for Boeings commercial and defense expectations. There are rumors they are first in line for a large training aircraft defense contract. They also seem to be booking nice commercial airline replacement orders. A little concerning that this is trading above long term monthly trend while the markets are showing cracks at the seams. Really how much more good news can propel this higher. I get concerned when the log scale starts spreading out like it is on this stock.
GBPJPY 15min. LongHey Associate,
Looking we have a potential Bat Pattern on a 15min chart on FX:GBPJPY
Please make sure you know where your Entry TP levels and Stop loss....
Make sure you follow your plan YOUR plan & Remember Now Revenue.. Happy Trading Friends
FilipinoCasino - Spreading good Energy

BA: Overextended with MomentumAfter almost a year of accumulation below the 160ish high, the accumulation was ended with a Terminal shakeout on massive volume. That probably washed out most of the longs. We tested for a while b/w 120-130, hit the market on 6/24 to get out any last longs. Then the bull rally started.
I drew the modified schiff off the terminal shakeout because that's most likely the point where the goal to reach above the major old swing high was established so naturally the people that helped cause the selloff and accumulated there would be bulling the market in their behavior/style for the next phase.
Now we've been extending hard since 2-13 and we've made an excursion out of the UMH which means a change of behavior and lot of emotional enthusiasm. Then we get a hard down day to retest the UMH.
I'd like to see a break of the UMH, retest from the downside and drive back to the ML, gap zone, and previous swing high. I'm waiting though because Momentum can continue to carry price into excess until it's broken.
Just watching for now, seems to be setting up nicely.

Speculative short on BOEINGBOEING lends itself for a speculative short position as the price has reached a long term resistance line from the tops in 2007 and 2015. The 2015 top was also the 1.618 fibonacci extention from the top in 2007 en the bottom in 2009. Be carefull with a short position though as there no indicators yet of a weakening of the current uptrend. The price trend is upwards, and both the MACD and the RSI do not show signs of weakening (bearish divergence).
I do not have a position in BOEING.

$BA Trump pullback was what it needed for new highsThe pullback after Trump's tweet about AirForce One pricing was just what it needed to continue the pattern. It has already broken the 2015 high, looks like further gains are on the way. TP 167.50
