BABA Bullish DivergenceLooking at the 8hr chart and indicator it seems like bullish divergence. Do you agree?
BABA

BABA Testing MA200 since Feb21The Last time BABA touch MA200 was in 22 Feb 2021. Since then, BABA has been trending downwards below MA200 line, struggling to even surpass the ichimoku cloud and the downwards channel
Some Positive Signs of Reversal
-break above parallel channel
-Candlestick interact with MA 200
-Candlestick went above ichimoku cloud during june-july 2022
-Higher high(HH) formed
-Higher Low(HL2) seems to retrace lesser than HL
-Lagging span went above candlesticks(currently within the clouds)
-High trading volume at 73.39(speculative support)
Currently BABA still in bearish mode
-moving under MA200 and underneath ichimoku cloud
Some Strategies :
Conservative: Wait for candlestick to go above both MA200 & ichimoku and enter during retracement. Stop loss 5-10% below 73. More Margin of Safety & Lesser Future Gain
More Aggressive: Enter now(on the lower part of black parallel channel). Set TP at 136 or Expected uptrend of 1:1 of Line B from HL2. Stop loss 5-10% below 73. Lesser Margin of Safety & More Future Gain
#ALIBABA #BABA

YINN China 3X Leverage ETF Reverses off the bottom Swing Long
AMEX:YINN YINN is now in an uptrend with an increasing cloud score
and upgoing BB boundaries. Stop Loss at the double bottom
while the first target is the recent consolidation period
with about 15% upside to that take profit and about a
2.5 Reward to Risk
All this makes YINN a candidate for a swing long trade

BABA Potential for Bearish Drop | 12th August 2022On H4, as there is a bearish divergence of price and MACD , and the price is almost breaking the ascending trend line , we have a bearish bias that the price may drop from our sell entry at 162.78, where the price is testing. If the price break the sell entry, we could take profit at 149.55, which is in line with the 38.2% fibonacci retracement . Alternatively, the price may rise to the stop loss at 173.01, which is in line with the pullback support and 78.6% fibonacci retracement .
Any opinions, news, research, analyses, prices, other information, or links to third-party sites contained on this website are provided on an "as-is" basis, as general market commentary, and do not constitute investment advice. The market commentary has not been prepared in accordance with legal requirements designed to promote the independence of investment research, and it is therefore not subject to any prohibition on dealing ahead of dissemination. Although this commentary is not produced by an independent source, FXCM takes all sufficient steps to eliminate or prevent any conflicts of interest arising out of the production and dissemination of this communication. The employees of FXCM commit to acting in the clients' best interests and represent their views without misleading, deceiving, or otherwise impairing the clients' ability to make informed investment decisions. For more information about the FXCM's internal organizational and administrative arrangements for the prevention of conflicts, please refer to the Firms' Managing Conflicts Policy. Please ensure that you read and understand our Full Disclaimer and Liability provision concerning the foregoing Information, which can be accessed on the website.

BABA Potential for Bearish Drop | 12th August 2022On H4, as there is a bearish divergence of price and MACD, and the price is almost breaking the ascending trend line, we have a bearish bias that the price may drop from our sell entry at 162.78, where the price is testing. If the price break the sell entry, we could take profit at 149.55, which is in line with the 38.2% fibonacci retracement. Alternatively, the price may rise to the stop loss at 173.01, which is in line with the pullback support and 78.6% fibonacci retracement.
Any opinions, news, research, analyses, prices, other information, or links to third-party sites contained on this website are provided on an "as-is" basis, as general market commentary, and do not constitute investment advice. The market commentary has not been prepared in accordance with legal requirements designed to promote the independence of investment research, and it is therefore not subject to any prohibition on dealing ahead of dissemination. Although this commentary is not produced by an independent source, FXCM takes all sufficient steps to eliminate or prevent any conflicts of interest arising out of the production and dissemination of this communication. The employees of FXCM commit to acting in the clients' best interests and represent their views without misleading, deceiving, or otherwise impairing the clients' ability to make informed investment decisions. For more information about the FXCM's internal organizational and administrative arrangements for the prevention of conflicts, please refer to the Firms' Managing Conflicts Policy. Please ensure that you read and understand our Full Disclaimer and Liability provision concerning the foregoing Information, which can be accessed on the website.

BABA - TRADE PLANCheck out the trade plan for BABA today based on the technical analysis. Hit the thumbs up if you like the content.

Chinese Stocks Inverse H&S reversal? BABA had strong earnings and beat earnings expectations.
The stock popped and retraced back however it is showing nice support on that right shoulder along with XPEV and & NIO.
I like these stocks as a buy here and think they can easily reach the neckline resistance by the end of the month. They
They have all broke their respective downtrends.
XPEV & NIO have earnings this month and with many people converting to electric vehicles they could surprise us in a good way.
Im still skeptical on SPY at current levels so I would like to see how these stocks react on the next retracement/correction/continuation.

Safer way to Be long BABA DOTM 80 PutHi everyone,
China this am came out with a better tone toward their tech industry and markets.
Assuming that geo political events do not get worse between the USA vs China.
I am making a Long term asset accumulation bet on Alibaba
1) I discuss straight stock asset ownership
vs
2) Getting an income by selling the deep out of the money 80 strike September put for $9.15 resulting in a
11.43% ROI as of this writing, also providing us a safety of margin from current $97 price to 70.85 assignment cost
2 Outcomes
a) stocks goes up and stay above the 80 strike by the September Expiration date we pocket the 11.43% or $9.15
b) Stocks tank below 80 get called and I own Alibaba stock the asset, at a price I already decided was a comfortable and good support around (assignment price $80-9.15)=70.85
Hope it helps this strategy is only valid with two things in mind
1)buy asset you love and want to keep for the long term
2)be prepared to hold if it goes below 70.85 and be confident enough of the long term 5-20 years for the underlying stock as an asset in this case Alibaba
Hope it helps
Marc

$BABA Is Alibaba Ready To Be Treasured In Our Portfolios?Traders, Speaking to my of my investor friend in the US around a year ago, I predicted alibaba to fall below 100 and that's when we could get a chance to buy back again. Alibaba $BABA Has been consolidating at the current levels for few months under 100 dollars. Now as it has created a very good pattern inside the bollinger band, this can become a speculative buy in our portfolio again. The risk is limited i.e. stop loss will be below last lowest low and the target much higher giving us very good Reward to Risk.

BABA may retest 87 zone if 100 fails; upsides are 110/120/130If BABA fails to hold the psychological 100 yellow zone, the the green 87 zone may be retested due to low volume below 100. Breaking 100 will also mean breaking below the red uptrendline as well as the Ichi Cloud in daily chart.
However if BABA holds 100 & the uptrendline, then we may see upside targets at 110, 120 & even 130. Last July there was a 2-day false BO above 120 resistance before BABA reversed down back inside the downward Fib Channel to retest 100. Breaking ma200 above 120 will be bullish.
Not trading advice

Forecast № 29 BABA (ALIBABA GROUP HOLDINGS LTD) NYSEForecast for price reduction. Earlier, the forecast No. 20 for price reduction was published. The downtrend continues

$BABA short idea Alibaba $BABA is a Chinese E-commerce platform that flourished during COVID but is now struggling due to currency exchange, supply chain, and lockdowns in China.
Bearish technicals show a bear flag with price right at the breakdown levels here. Downside levels are 94, 92, 89, 84. Stop loss 105.
OptionsSwing Analyst
Daniel Betancourt

Chinese stocks have incredible surprise for youChina is number one, huh? Are you really afraid of communistic party going mad and destroying everything they've earned with hard work last 20 years?
They already spread covid and use their russian doll to harm West and that will be enough for them to continue going forward and building more trading routes in South America, Africa and Asia. China is here to stay no matter you like it or not, but they are working hard and providing value.
Long your longs before FED change it's policy in September-November and revaluate food and energy weight in CPI indexes or else...
Also most covid noob plebs already out of stonks and crypto and done with investing, rooting in a crisis.
Would you buy the blood and fear here or sell with normies is the question?!
Dollar value is still going down since the day it was born no matter what.

KWEB: UNIQUE LONG TERM OPPORTUNITY?KWEB, Chinese internet ETF
Chinese techs have been in a bear market since February 2021, with the price of KWEB unable to break above the long trend line (in blue).
Kweb has found a bottom in March 2022.
Is Kweb bullish? Is it the end of the bear market for Chinese tech stocks?
Here is everything you need to know before making a decision:
- Currently the price is trying to create a bottoming base as we have seen higher lows (light black line) since March and the bearish trend line (blue) was broken.
- I see an ascending triangle with the top horizontal line of the triangle at 32.71. We tried to break this line 3 times but failed to maintain above. A sustainable break above 32.71 would be considered as bullish.
- We could backtest the rising black line of the ascending triangle before starting a bullish trend, but not sure.
- Mind the small gap around 28 that could also be filled.
- We're above the ichimoku cloud, which shows that the trend is changing. The lagging span (in green) still have to confirm the change of trend by crossing the bearish blue trend line.
- China in quantitative easing mode as western economies are tightening.
I'm long KWEB with a long term view. My buying zone is between 30 and 27.74 with a stop at 26.40 .
Trade safe.

$CHINAH bearish set-up? 👁🗨*This is not financial advice, so trade at your own risks*
*My team digs deep and finds stocks that are expected to perform well based off multiple confluences*
*Experienced traders understand the uphill battle in timing the market, so instead my team focuses mainly on risk management
Bitcoin along with the US market should take a decent hit sometime this week due to the continuation of strength in the US dollar. Bear-Index's, the dollar, and energy appear to be where the money will be flowing during this period if this does play out. This would lead to a temporary slowdown in the growing Chinese economy and allow it to retest support.
!! This chart analysis is for reference purposes only !!
If you want to see more, please like and follow us @SimplyShowMeTheMoney

BABA - Bullish BreakBABA has made a strong reversal
Broadening Wedge
I see this reversal continuing, letting price hit the middle dotted trend line and then forming a nice support above 0.5
Very cheap buy the dip scenario

BABA AnalysisPrice is on an uptrend. Price took liquidity and stop hunted the highs at 124.11. Price is unable to close higher. Price has been building sell-side liquidity on its way up. Expect price to retrace down to bullish POI.

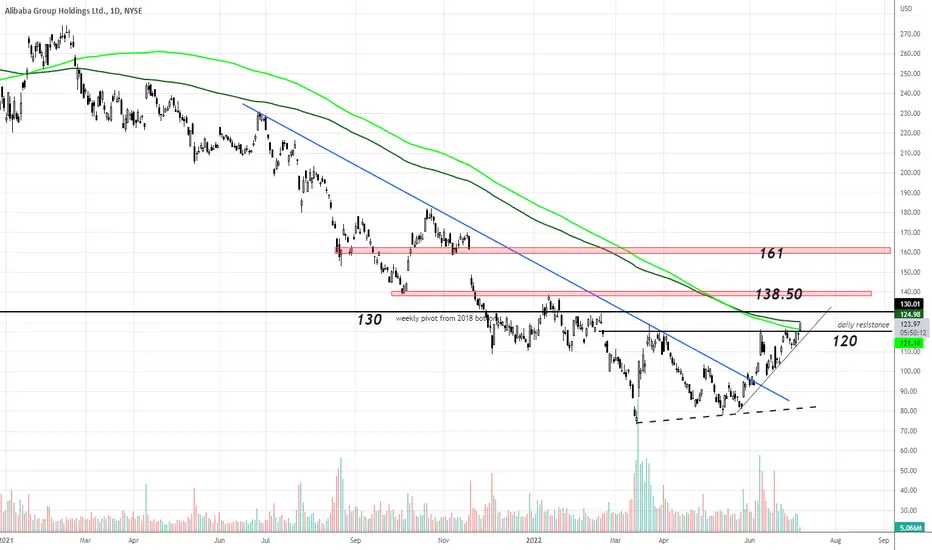
#ALIBABA looking structurally bullishReally like the way Alibaba is bottoming here. Not only have we broken the steep downtrend which has held price down for the last year, but we have broken horizontal resistance at $120 while holding above a new daily uptrend line. Today is the first break above the 200dma since Feb 2021, which is another encouraging sign. Should we hold this breakout above $120 on the daily close today, next targets are $130 which was a major weekly pivot bottom from 2018. Further targets sits at 138.50 and then 161.
BABA is a thing of beauty!Nearing the D 200MA. It needs to break through and hold and I'm going to be adding to my positions. It got close 4 times in past couple of weeks.

Flags and Coffeecan consolidate between 18.50 and 21.00 for 10 sessions before making breakout
positive corporate news, China news, or other major catalyst can force move instantly

WATCH $BABABullish
Fundamental
- Inflation Macro environment / fear sentiment
- Funds Accumulation
- Positive PE
- Negative PEG ( seems leaning towards a value stock )
- Positive P/FCF
- Weak Sector / Industry / not Leader
- Very competitive online retail market
Technical
- Momentum Theory Indicator - break out downtrend / bottomed out
- Price action formation ( falling wedge )
- Broke out downward trend line and retest
- Price above POC
- Price below major S/R level
- Huge volume spike!
- MACD divergence
Entry idea
- Entry idea was based on few confluences
- Price above major S/R level
- Price above fibo level
- Price above 200 MA
Stop loss set on previous low or POC level
" STEPS BY STEPS, BASE CAMP TO BASE CAMP. I WILL SUMMIT"
Cheers and happy trading!

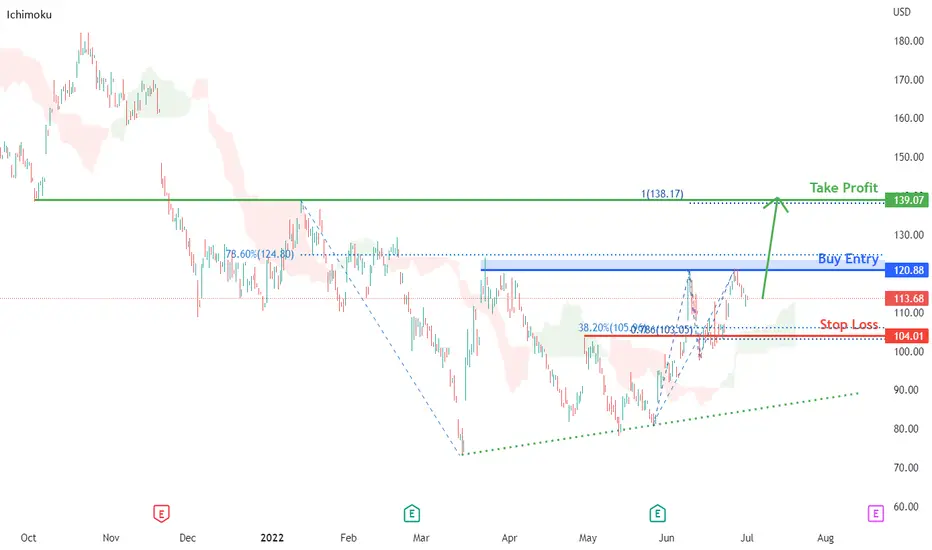
BABA Potential for bullish momentum | 1st July 2022On the H4, with prices moving above the ichimoku indicator, we have a bullish bias that price will rise to buy entry at 120.88 where the swing high resistance and 78.6% fibonacci retracement are. Once there is upside confirmation, we would expect bullish momentum to carry price to take profit at 139.07 in line with overlap resistance and 100% fibonacci projection. Alternatively, price could drop to stop loss at 104.01 where the pullback support, 38.2% fibonacci retracement and 78.6% fibonacci projection are.
Any opinions, news, research, analyses, prices, other information, or links to third-party sites contained on this website are provided on an "as-is" basis, as general market commentary, and do not constitute investment advice. The market commentary has not been prepared in accordance with legal requirements designed to promote the independence of investment research, and it is therefore not subject to any prohibition on dealing ahead of dissemination. Although this commentary is not produced by an independent source, FXCM takes all sufficient steps to eliminate or prevent any conflicts of interest arising out of the production and dissemination of this communication. The employees of FXCM commit to acting in the clients' best interests and represent their views without misleading, deceiving, or otherwise impairing the clients' ability to make informed investment decisions. For more information about the FXCM's internal organizational and administrative arrangements for the prevention of conflicts, please refer to the Firms' Managing Conflicts Policy. Please ensure that you read and understand our Full Disclaimer and Liability provision concerning the foregoing Information, which can be accessed on the website.
BABA respecting the diagonal trendlineSo far BABA is respecting the diagonal trendline and we've expected this retest. The short and midterm MA's are still in uptrend. BABA is approaching 200 MA, which will be crucial to break and continue higher. We'll most likely retest around there again. Fingers crossed. LT investors deserve some relief in this stock.
