BABA

BABA FAKING IT?Alibaba (BABA) has been a total dog so far this year. Shares were trading well into the fourth quarter of 2020 but then a string of issues pummeled the stock.
Regulators disrupted Ant's initial public offering, then dug deeper on Alibaba and dialed up the heat.
Investors don’t like regulatory issues as it is but particularly when we’re dealing with Chinese regulators.
However, in April, Alibaba paid a smaller-than-expected but still record fine, hoping to puts its regulatory issues behind it. Still, the stock hasn’t responded the way bulls were hoping.
All of this comes as the S&P 500 and Nasdaq continue to grind out new all-time highs.
It also comes as FAANG stocks continue to trade incredibly well. Alphabet (GOOGL) - Get Report is the top performer with a near-40% gain in the first half of the year, while Netflix (NFLX) - Get Report is the worst, with a 2.3% drop.
Alibaba has a similar first-half performance, down 2.6%. However, it’s doing far worse from the highs, down more than 30%.
Call me a hopeless optimist, but I feel that Alibaba can have a solid second-half performance.
Shares continue to hold the $210 to $212 area and have recently cleared downtrend resistance . That said, there’s plenty of overhead hurdles.
A push over $235 - thus putting it over all of the moving average hurdles mentioned above - could open up a run to $250, then $263. Above $275 and $300 is in play.
Keep the risk in mind but this could be a solid second-half rebound play.

BABA chart for July 2$BABA
Calls above 223.08
Puts below 221.56
Both upside and downside targets listed


NTES - Seasonality playNtes is a technology company engaged in the development of applications, services and other technologies for the Internet in China. July produces an avg of +1% over past 5 years. There is decent open interest in the july 16 115 and 120 calls. I have seen a fair amount of bullish option flow for china tech stocks. JD BABA , GL!


ROKU**News came out today about Apple buying Roku remote button for Apple TV+ app.
Call sweepers were active.. 95% bullish call flow. 2 Dark Pool Prints $100M+
Today was a great example of waiting for the right catalyst aligned with a key level break.
448 was the entry. ROKU can make a run towards 486 by Friday this week if it can hold above.
Trade Idea: 475C 7/2 BID/ASK: 3.90/3.95.

BABA strengthBABA showing strength for the first time in months since treasuries brought growth stocks down. With the 10 YR residing at 1.4 and growth pushing back up as investors are becoming risk-on, I'm looking to Chinese tech as a favorable growth play. BIDU is also in motion currently!

BABA is a BUY nowI think this stock is of fantastic value, both from a fundamental and a technical stand point.

BABA two scenarios UP or DOWN.If will go up then there are obvious two levels of TP. I am more interested if my timing projection is correct.
The second scenario is the opposite.
Could go sideways of course but that's no fun to forecast.

BABA Stock in good area to buy1- 61.80% FIB , the price didn't goes lower than this point.
2- 205 to 212 important support area .
I think it is good to buy from this area , target 1 : 245
target 2 : 270
target 3: 310
but I don't know if China Government will accept that …😂😂
Good Luck

$PBTS DD $1 - $9Hello everyone,
I hope you're having a great weekend so far.
DISCLAIMER:
I AM NOT A FINANCIAL ADVISOR. THIS IS NOT INVESTMENT ADVICE, I AM SIMPLY PASSING ALONG RESEARCH I HAVE GATHERED. BUYING/SELLING POWERBRIDGE TECHNOLOGIES ($PBTS) WOULD BE AT THE DOING OF YOUR OWN. PLEASE DO NOT INVEST BLINDLY, NOR USE THIS AS YOUR ONLY SOURCE OF INFORMATION.
*** I attempted to be as informative as I could possibly be. If I missed a few details, please feel free to comment them below.*** Best of luck to you all!
What you will find in this DD:
Industry Background
About Powerbridge Technologies
History
Solutions & Services
Powerbridge System Solutions
Powerbridge Saas Services
Powerbridge BaaS Services (BLOCKCHAIN TIE)
Other Core Technologies
Financials
Management & Board Team
Why I Like It.
Key Factors
Final Remarks
Global trade is characterized by its extended workflows with complicated compliance and logistics processes, voluminous documentation and time-consuming paper handling, cumbersome and costly peer-to-peer messaging and multiple players from different disciplines. A typical export process in China for a single shipment may involve:
Industry Background
Industry Background - The Belt & Road Effect in China and Globally
About Powerbridge Technologies:
Powerbridge Technologies - About
A Nasdaq listed company (PBTS), Powerbridge is a provider of software application and technology solutions and services to corporate and government customers engaged in global trade in China. Founded in 1997, Powerbridge pioneered global trade software applications with a vision to make global trade operations easier for customers. Since inception, Powerbridge has continued to innovate and deliver solutions and services to address the changing needs of thousands of customers. Powerbridge’s mission is to make global trade easier by empowering all players in the ecosystem.
History:
Solutions & Services:
Powerbridge System Solutions
Comprehensive and robust customized solutions and packaged products that allow customers to streamline and optimize operations in regulatory compliance, trade logistics and trade financing.
Trade Compliance Solutions
Allow government agencies and regulatory authorities greater control and security, better use of resources, higher duty collection, faster processing time and higher compliance and logistics efficiency in servicing global trade businesses and logistics service providers.
Trade Enterprise Solutions
Enable global Trade businesses in diverse industries to manage business operations, simplify trade and transaction processes, streamline compliance and logistics processes, reduce document handling, minimize operational cost and increase overall productivity.
Trade Loan & Insurance Services
Designed to facilitate global trade loan, insurance, settlement processing services. Enables global trade businesses, financial service providers and trade insurance providers to reduce workflow complexity, processing time and operational cost while increase processing efficiency.
Powerbridge SaaS Services
Comprehensive and robust customized solutions and packaged products that allow customers to streamline and optimize operations in regulatory compliance, trade logistics and trade financing.
Service Offerings
Core Benefits
Powerbridge Technologies Announces Successful Launch of its Cross-Border eCommerce SaaS Service Platform
Powerbridge BaaS Services:
Empower all players in the global trade ecosystem to synchronize and collaborate in unprecedented ways to increase operational efficiency and reduce trade cost across the global trade supply chain.
Compliance Blockchain Services
Designed to provide multiple government agencies and authorities a single view or truth of trade events and documents, allowing them to collaborate and streamline regulatory compliance activities with enhanced compliance effectiveness and operational efficiency.
Supply Chain Blockchain Services
Designed to provide end-to-end visibility and transparency for broad synchronization and collaboration among all business, government and service provider players in the global trade ecosystem in which the trade process is facilitated and optimized.
Logistics Blockchain Services
Designed to enable global trade businesses and logistics service providers to optimize cross-organizational workflows by automating contract execution, streamlining document handling and synchronizing information exchange throughout the logistic process.
Trade Loan & Insurance Processing Blockchain Services
Designed to enable global trade businesses easier and faster processing for loans and insurance with lower cost and faster processing and to allow financial service providers improved visibility on trade events for better and more assured decision makings that mitigate risks.
Powerbridge Technologies Launches Blockchain Cross Border Compliance Platform at Nanning Customs

$BABA Still waiting!BABA ended the week strong with heavy call volume near Friday's close. Since last time I charted BABA, it dipped into my buy zone near the fib level and bounced fast. Notice how it bounced off the Oct VWAP from last year. Also notice how the weekly high is the 21 EMA, which is telling of this swing. Without an active sequence, it will be hard to tell as of right now if this is the bottom. It wouldn't surprise me if BABA went even lower to test last year's price range between 165-190, and I would be wary of going long here still. I will continue to watch BABA, hoping that it can show strong indication that a bounce is in on a strong Fib level and bouncing off the lower VWAP. So far the monthly low continues to be 204, right at the Fib level. Below 204, we can consider it a short term correction looking for lower prices.

BABA finally moving! I'm in 10 leaps of BABA. It's been in downtrend and silent for a while, but seems like this baby woke up! There's so much volume and strength, we need to break through the $231 resistance (100 SMA ) and then we're going to continue to another strong resistance $249 (200 SMA ). Plus the MOMO algo signal went long.

BABA - finally moving! I'm in 10 leaps of BABA. It's been in downtrend and silent for a while, but seems like this baby woke up! There's so much volume and strength, we need to break through the $231 resistance (100 SMA) and then we're going to continue to another strong resistance $249 (200 SMA).


BABA, Forming This Massive Descending-Triangle, Likely Breakout!Hello Traders Investors And Community,
Welcome to this analysis about Alibaba in which I will look at the 12-hour timeframe perspectives. Since the Alibaba founder, Jack Ma moved into isolation because of a government critical speech the stock developed an exceptional downtrend with bearish alignments mainly reaching the 205 level. Now as there came news the founder still active and operating on the company this can also lead to potential positive developments on the fundamental sight of things matching with the technical factors I detected recently, therefore I am looking at all the important levels and likely destinies we should consider with the stock in the current structure and upcoming movements.
Structural Developments:
As when looking at my chart now we can watch there how Alibaba has formed this massive descending-triangle-formation with the coherent wave-count within and the waves A to C already completed. Such a triangle-formation is known to produce a substantial bullish reversal with further continuations and an increase in volatility to the upside. Recently Alibaba already formed this initial spike of bullishness to the upside within the triangle testing the upper boundary of the triangle-formation and also the 100- as well as the 65-EMA lying there, above these EMAs Alibaba will form a sustainable bullishness as the previous resistance gets support.
Upcoming Perspectives:
As Alibaba already formed all these strong initial terms in the structure it is likely that the triangle completes with a bullish breakout in the next times which will finally happen with the close above the upper boundary. It is seldom seen that such a structural triangle invalidates to the downside nevertheless it is important to keep patient till the triangle finally completes. Mainly the upcoming breakout can be traded either aggressively with immediate entry or conservative with an entry after confirmation, although the aggressive entry is also possible the conservative one will be much smarter. It will be an interesting development ahead.
In this manner, thank you for watching my analysis about Alibaba and the current descending-triangle-formation forming that has the potential for a bullish breakout, will be great when you support it with a like and follow or comment, great contentment for everybody supporting, all the best!
Information is only educational and should not be used to take action in the market.

$AAPL $NFLX $BABA $SNOW I OptionsSwing WatchlistBABA 1D I BABA broke from a massive falling wedge established last year, and its ready to run up into its earnings.
AAPL 1D I We saw AAPL break from a triangle pattern and retest the breakout just to make a higher high. Expecting to consolidate near $130.
NFLX 1H I After seeing a consolidation near the $500 price level, we saw NFLX make a push last week to $530 as expected.
SNOW 4H I Following growth stocks, particularly cloud stocks as they are making a quick comeback. SNOW is near IPO levels and we want to see consolidation above $250 for continuation.

BABA Breakout?Baba has been rejected from the resistance over 5 times and this time its broken out with higher volume, rsi reaching over 90 on the 1 hour chart and it closed above. Everything here looking like a tech run in July. I suspect it to retest the 224 support and if we see a big drop it still has between 220-215 support now. Looking very bullish imo


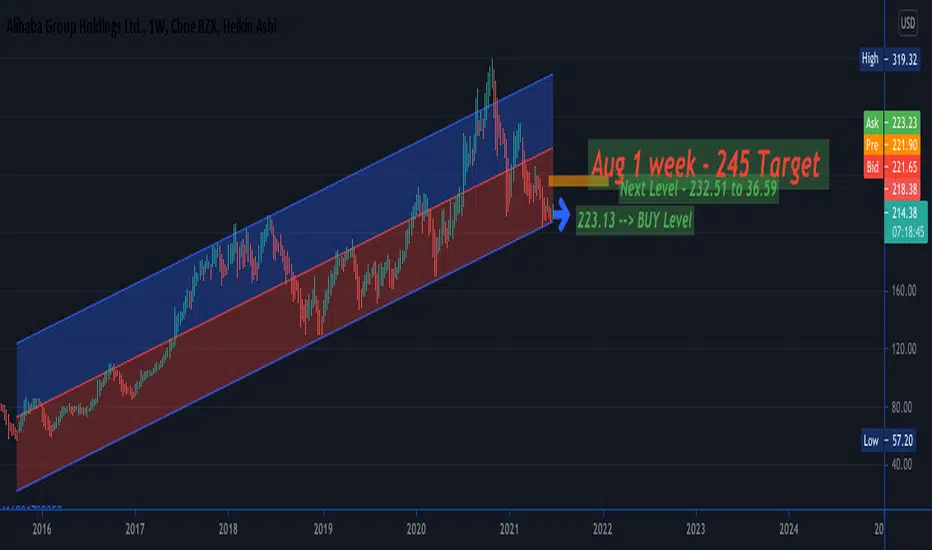
BABA - BUY 223.13 - Target 245 level by 4 AUGABA has broke the trend and will move in upward direction. Based on Elliot wave count analysis
1st Buying level - 223.13 - if it cross this level, then will touch 232.51
2nd Buying level - above 236.59 to 239 - if it cross 239 then will touch 245 ( Target July 27 to 5 Aug )
Note : There will be a minor pullback once it touches 232.
BABA LONG...consolidation breakoutBABA consolidation right now, and possible trend line breakout in play
