Alibaba - This chart is pretty bullish!🎁Alibaba ( NYSE:BABA ) will head much higher:
🔎Analysis summary:
After we saw the perfect creation of the rounding bottom on Alibaba, the trend finally shifted back to bullish. Especially with the recent bullish break and retest, Alibaba is now preparing for another major move higher. All we need now is simple bullish confirmation.
📝Levels to watch:
$140
SwingTraderPhil
SwingTrading.Simplified. | Investing.Simplified. | #LONGTERMVISION
Bababuy

Alibaba - A remarkable reversal!🛒Alibaba ( NYSE:BABA ) reversed exactly here:
🔎Analysis summary:
Recently Alibaba has perfectly been respecting market structure. With the current bullish break and retest playing out, there is a very high chance that Alibaba will rally at least another +20%. But all of this chart behaviour just looks like we will witness a major bottom formation soon.
📝Levels to watch:
$110, $135
🙏🏻#LONGTERMVISION
Philip - Swing Trader

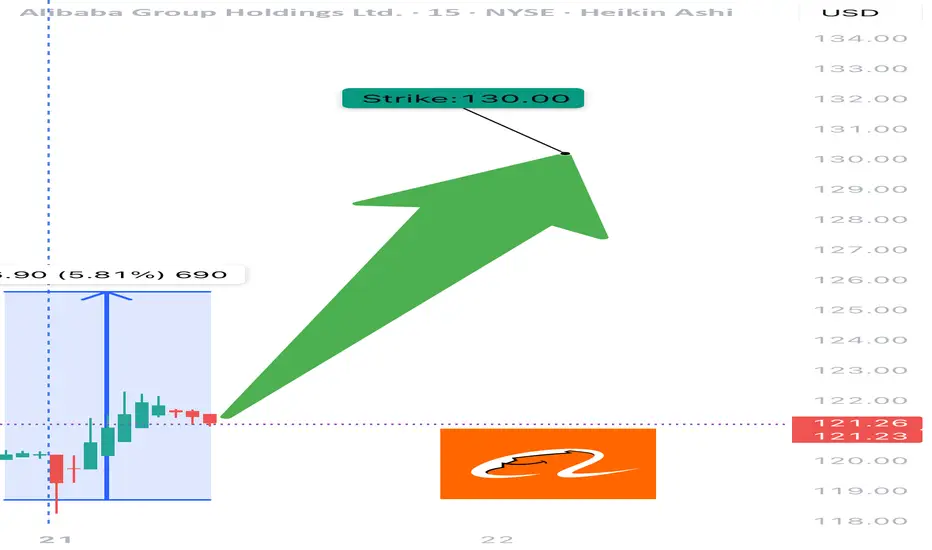
BABA WEEKLY TRADE IDEA – JULY 21, 2025
🐉 NYSE:BABA WEEKLY TRADE IDEA – JULY 21, 2025 🐉
📈 Strong RSI. Institutional Accumulation. Gamma-juiced upside.
Momentum is building — timing is key.
⸻
📊 Trade Setup
🔹 Type: Long Call
🎯 Strike: $130.00
📆 Expiry: July 25, 2025 (4 DTE)
💰 Entry Price: $0.52
🎯 Profit Target: $0.74 (📈 +42%)
🛑 Stop Loss: $0.30 (~40% Risk)
📈 Confidence: 70%
🕰️ Timing: Enter at Monday Open
📦 Size: 1 Contract (or scale accordingly)
⸻
🔍 Why This Trade?
✅ Daily RSI = 68.3 → Bullish momentum building
✅ Volume = 1.3x week-over-week → Institutional buying confirmed
📊 Neutral Call/Put Flow → Sentiment not overheated = better entry
🧠 Multiple models agree on MODERATE BULLISH bias
🌬️ VIX stable = ideal for controlled option premium entries
💎 Gamma risk manageable, but monitor price spikes at resistance near $130–132
⸻
⚠️ Risk Management Notes
🔸 RSI near breakout zone → monitor for fakeouts
⏳ Only 4 days to expiry → time decay risk accelerates
📉 Watch for rejection near key levels ($130.50–132.00)
🛑 Respect the stop: If momentum stalls early, exit fast
⸻
📌 Execution Strategy
🔹 Enter clean, single-leg naked call
🔹 Exit partial at 30% profit, full by Thursday unless breakout is strong
🔹 Avoid spreads: delta exposure preferred for upside spike capture
⸻
🏁 Verdict:
All models point to upside, but not full conviction.
This is a momentum + positioning trade, not a breakout gamble.
NYSE:BABA 130C – Risk $0.30 to Target $0.74 📈
Tight structure. Moderate aggression. Execute with precision.
⸻
#BABA #OptionsTrading #CallOption #WeeklyTrade #MomentumPlay #UnusualOptionsActivity #TradingViewIdeas #GammaFlow #FlowBasedSetup #Alibaba
Alibaba | BABA | Long at $108.84Like Amazon, I suspect AI and robotics will enhance Alibaba's NYSE:BABA e-commerce, logistics, and cloud computing operations. There is some risk here, like other Chinese stocks, that they could be delisted from the US market if trade/war tensions rise. But I just don't think that is likely (no matter the threats) due to the importance of worldwide trade and investment. I could be way wrong, though...
NYSE:BABA has a current P/E of 14.2x and a forward P/E of 2x, which indicates strong earnings growth ahead. The company is very healthy, with a debt-to-equity of 0.2x, Altmans Z Score of 3.3, and a Quick Ratio of 1.5. If this were a US stock, investors would have piled in long ago at the current price.
From a technical analysis perspective, the historical simple moving average (SMA) band has started to reverse trend (now upward), indicating a high potential for continued (overall) price movement up. It is possible, however, that the price may reenter the SMA band in the near-term - the $80s aren't out of the question - as tariff threats arise. But that area is another personal entry zone if fundamentals hold.
Thus, while it could be a bumpy ride and the risk is there for delisting, NYSE:BABA is in a personal buy zone at $108.84 (with known risk of drop to the $80s in the near-term).
Targets into 2028:
$125.00 (+14.8%)
$160.00 (+47.0%)

BABA: Swing Trade Setup with 14% Upside🚨Swing Trade Setup: NYSE:BABA
Breakout = 🎯$162
Entry: $142.20
S/L: $135.65 (3to1 R/R)
Target: $162 (14% Higher)
NOT FINANCIAL ADVICE

BABA in a falling wedge (NEW)BABA stock has been in a long-term downtrend.
We're expecting the price to continue droping as it looks like it got rejected from the downsloping resistance line on the weekly timeframe.
What we can see on the chart is a pattern called a falling wedge.
Most likely the price will revisit $60 or lower but eventually we expect the breakout in Q2 or Q3 2023.
How to trade:
Enter long position if/when we get a breakout with a volume increase.
Final target and the take profit level are shown on the chart.
Good luck

BABA looks bullish. Are you ready?Are you still waiting for lower prices ?
Buying lows from 2016 was not cheap enough for you?
Baba created higher lows structure on weekly. Looks mega bullish. Expecting more upside soon
Target 1: 170 $
target 2: 200 $
Stop loss: 76,50 $

Alibaba Stock Surges 10% as Earnings Beat Expectations Shares of Alibaba Group Holding Ltd. (NYSE: NYSE:BABA ) are soaring after the Chinese tech and e-commerce giant reported quarterly earnings that exceeded Wall Street expectations. Alibaba’s latest financial results reflect strong growth in its cloud computing division, which includes artificial intelligence (AI) initiatives, and the broader market optimism surrounding its strategic moves.
Beating Estimates with Strong Revenue Growth
Alibaba posted revenue of 280.15 billion Chinese yuan ($38.5 billion) for the December quarter, marking a 7.6% increase year-over-year. The company’s earnings per share per ADS came in at $2.93, surpassing analyst expectations tracked by Visible Alpha. CEO Eddie Wu emphasized that Alibaba’s strategic focus on "user-first, AI-driven" operations has contributed significantly to its reaccelerated growth.
One of the standout aspects of Alibaba’s performance is its cloud computing segment, which saw a 13% year-over-year revenue increase. Notably, AI-related product revenue surged at a triple-digit rate for the sixth consecutive quarter, underscoring Alibaba’s position as a dominant player in China’s AI landscape.
Adding to the bullish sentiment is speculation that Alibaba may be collaborating with Apple (AAPL) to integrate AI-powered features into iPhones in China. Moreover, reports suggest that co-founder Jack Ma has re-established ties with Beijing, a development that could ease regulatory pressures and pave the way for smoother business operations.
Technical Outlook: Bullish Breakout with Strong Momentum
From a technical perspective, NYSE:BABA shares have been on an impressive run, climbing over 80% in the past year. At the time of writing, the stock is up 8.09% in intraday trading, signaling strong bullish momentum.
The breakout from a falling wedge pattern—a classic bullish reversal setup—has been a key catalyst in Alibaba’s upward trajectory. The Relative Strength Index (RSI) currently sits at 84, indicating that the stock is in overbought territory. However, with momentum building, further upside potential remains, particularly if BABA clears its recent one-month high.
In the event of a pullback, the 38.2% Fibonacci retracement level is acting as a solid support zone, providing traders with a potential re-entry point. A decisive breakout above resistance could trigger another leg up, reinforcing the stock’s bullish sentiment.
Conclusion
With cloud computing and AI revenues expanding at a rapid pace, alongside renewed investor confidence, the stock remains in a strong uptrend. While technical indicators suggest caution due to overbought conditions, a breakout above resistance could unlock further gains.

Alibaba Group | BABA | Long at $80.00Alibaba Group NYSE:BABA has the potential for massive growth. From a technical analysis perspective (and using my selected simply moving averages (SMAs)), the price of NYSE:BABA is reconnecting with its primary SMA. It could ride this area for a while as it consolidates further, but this often means a future reversal of the downward trend. Thus, at $80.00, NYSE:BABA is in a personal buy zone.
Target #1 = $89.00
Target #2 = $94.00
Target #3 = $107.00
Target #4 = $116.00
Target #5 = $305.00 (very long-term view...)

I'm GAGA for BABA!NYSE:BABA
🎯134🎯150🎯171
Five weeks of green candles for over 55%!
Road this one higher from the beginning and fully exited. Now that we are pretty extended and broke out of the Inverse H&S Pattern I'd like to see a pullback to retest the breakout at $115-118 for an entry back in.
- Green H5
- Volume GAP
- Wr% Up trending
- Inverse H&S breakout
- China has momentum (look for tariff news or earnings this week to provide a dip buying opp.)
Not financial advice

BABA: It is finally TIME!NYSE:BABA 🐼
China's GDP is soaring! 🚀
With the highest GDP growth since July 2023, all indicators are pointing to a BIG MOVE upwards. Check out the daily chart, friends—it’s looking bullish!
Catch you at George Washington 💵
Not financial advice

Why Alibaba is the Top Stock to Buy. Long-Term Investment 2025A very strong weekly demand imbalance at $85 took control on Alibaba NYSE:BABA Chinese E-commerce giant. Expecting a decent rally in 2024 and 2025. Long-term swing trade investment trade idea.

$BABA Primed for a Retest and Bounce! 80% Upside Potential!🚀 NYSE:BABA Primed for a Retest and Bounce! 80% Upside Potential! 🚀
🔍 Key Points:
Looking for a bounce after retesting the symmetrical triangle breakout
Awaiting the H5 Indicator to flip green for a bullish signal
Crucial to hold the volume profile shelf for continued upward momentum
Target Prices:
🎯 $107
🎯 $134
MM 🎯 $157

BABA looks to be bottoming I like $88 range as support buy, BABA has the look of a 2 year bottoming price accumulation.
First target $177.

Alibaba Group $BABA stock investment opportunity Alibaba Group NYSE:BABA stock is trying to pull back to strong demand imbalance on the weekly timeframe located at $86 per share. Patiently waiting for the correction before buying this giant Chinese stock.

ALIBABA Ready to Explode! Big Gains on the Horizon!Alibaba (BABA) Technical Analysis - 15-Minute Timeframe - Long Position Setup
Entry Price: $99.13
Stop Loss (SL): $97.32
Target Levels:
TP1: $101.36
TP2: $104.96
TP3: $108.57
TP4: $110.80
Market Context and Sentiment: Recent developments indicate strong institutional interest in Alibaba, as evidenced by prominent fund manager Zhang Kun making Alibaba a substantial holding in his portfolio. This investment has bolstered positive sentiment around Alibaba, further supported by strategic economic measures favoring leading tech stocks in China.
Technical Indicators:
Trend Direction: Positive momentum is observed with price action above the Risological Dotted Trendline, signaling a bullish bias.
Volume: Current volume at 16.04M aligns with the recent positive market sentiment, with average 30-day volume standing at 26.70M. This moderate volume increase reinforces the long setup validity.
Analysis and Outlook: This setup presents a well-defined long entry with clear stop loss and target levels. The bullish institutional interest provides a strong fundamental tailwind, which could drive price action towards initial and extended targets. Should the price break through TP1 at $101.36 with sustained volume, a continuation towards TP2 at $104.96 becomes likely, with potential progression to TP3 and TP4.
Conclusion: Alibaba's current price action and market sentiment create a favorable environment for a long position. Close monitoring is advised, particularly as price approaches each target, with adjustments as necessary to secure gains.

BABA Looks good above 80-81Excellent BUY opportunity in BABA. Consider entry above 80-81 with Stop Loss @56.95.
Position Size : 3% of portfolio.

$BABA COORECTED ELLIOT WAVE ANALYSIS In my Elliott Wave analysis of BABA, I've observed a corrective pattern since its inception, with the peak occurring during the 2020 bull market. The correction seemed to have ended when BABA hit bottom in 2022. Following this, it appeared to start a new upward wave (wave 1), followed by a corrective phase (wave 2), which now seems to be complete. It's important to note that the placement of the other waves is solely for identification purposes and does not indicate any specific targets. This suggests that BABA could be gearing up for a bullish wave 3, making it quite promising for the long term.

BABAVideoAnalysis. Have we bottomed or heading to $50.
Please let me know your thoughts about this stock.
Thanks BigMike

BABA Showing Some Bullishness Out of the Buy ZoneChinese stocks have been hurting from China's deflationary economic environment, as well as the Biden administration's restrictive measures for AI chips to China. I believe these factors have caused Chinese stocks to become extremely undervalued.
BABA is currently within my buy zone and is starting to show some bullishness. The price is near the lows of the monthly Bollinger Bands, which is favorable for a long trade setup. The price is also significantly below the EMA ribbon, which is also favorable for opening a long.
Price targets:
The white trendlines are my key resistance levels on the way up, and the EMA ribbon has also been acting as resistance that has pushed BABA's price lower. I think the EMA ribbon will act as a resistance zone for BABA on the way up as well.

Alibaba (BABA) -> This After -80%My name is Philip, I am a German swing-trader with 4+ years of trading experience and I only trade stocks , crypto , options and indices 🖥️
I only focus on the higher timeframes because this allows me to massively capitalize on the major market swings and cycles without getting caught up in the short term noise.
This is how you build real long term wealth!
In today's anaylsis I want to take a look at the bigger picture on Alibaba.
For me personally it was quite impressive that Alibaba stock dropped more than 80% after the massive 400% increase from 2015 to 2020.
Recently Alibaba stock retested and already rejected the previous all time low of 2015 and I think that it is just a matter of time until we will see a monthly bullish break of structure.
- - - - - - - - - - - - - - - - - - - -
I know that this is a quite simple trading approach but over the past 4 years I've realized that simplicity and consistency are much more important than any trading strategy.
Keep the long term vision🫡

BABA NEW WEEKLY LOWHere is a depiction of where BABA currently is relative to Market Structure. The WEEKLY has just confirmed a new weekly gap due the 4H's Gap above previous lower highs creating a HIGH. The current 4h chart closed in one of my most profitable patterns called the Inside Bar showing a consolidation after a powerful move to the upside representing a breather in the market before the next move. Will be looking to ride price up until a weekly high is punched in signaling a reverse in trend to continue with the overall bearish weekly trend.

BABA Pullback.Simple inside bar breakout. Entry over green line trim at high dashed line. Either use a % stop loss or last 10m candle after breakout.
